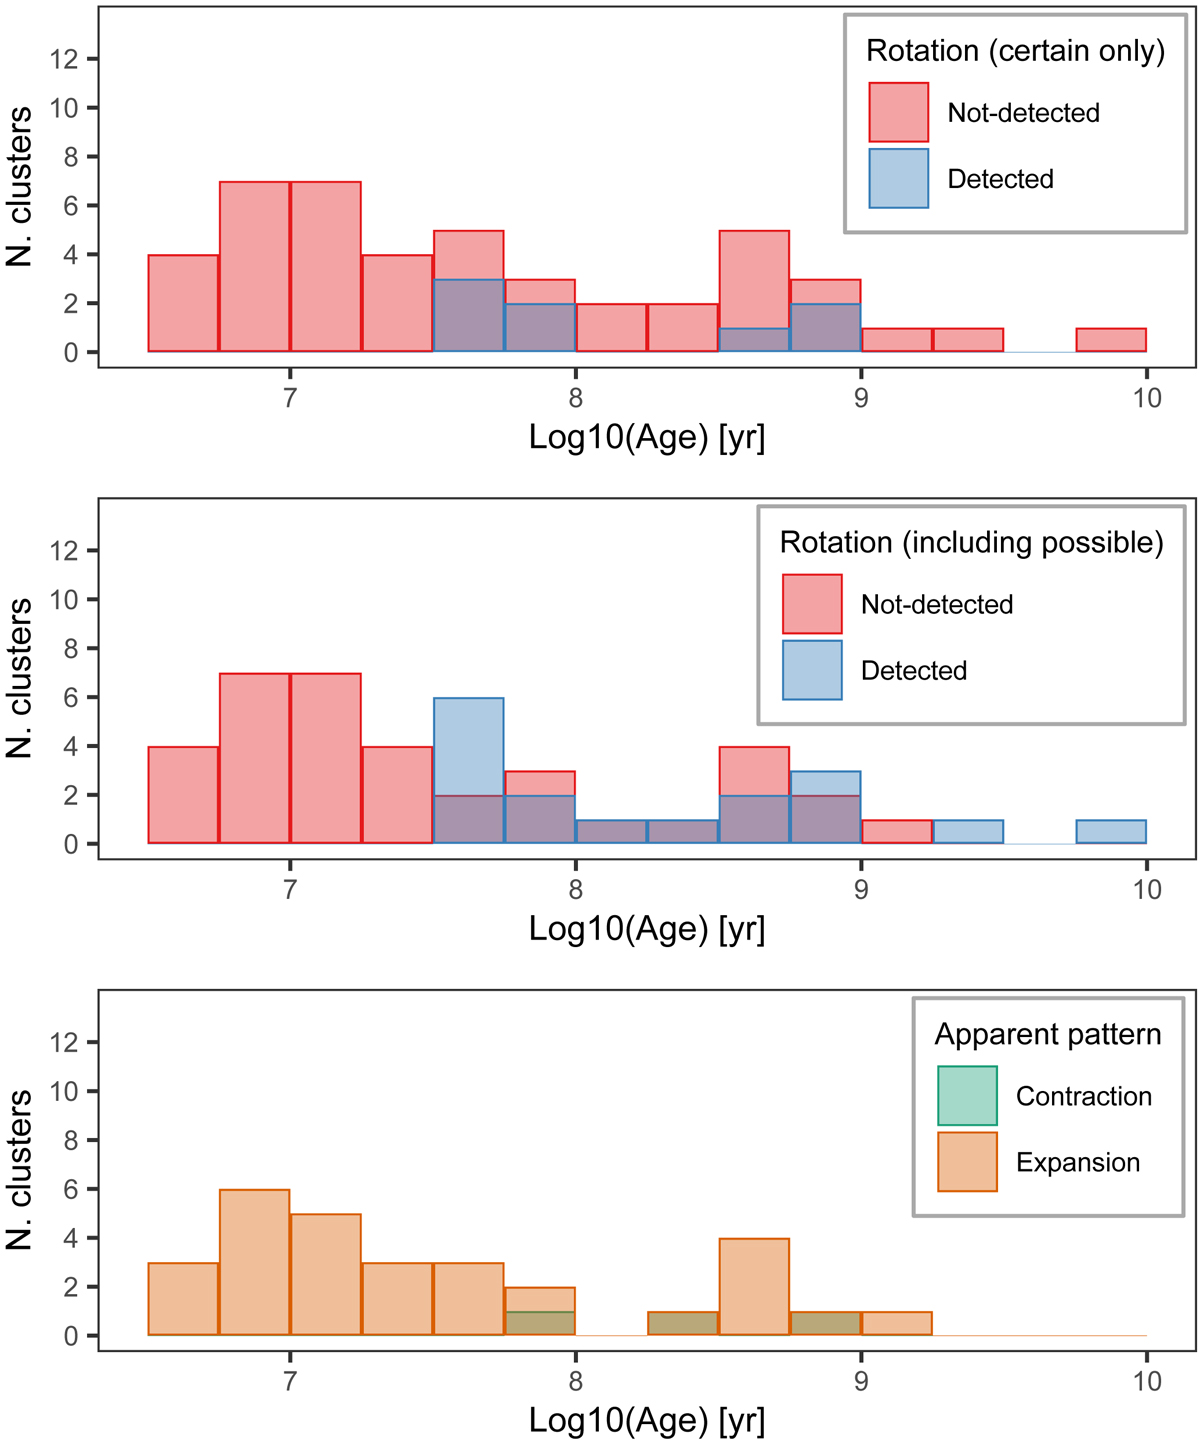
Fig. 3.
Download original image
Upper plot: age distribution of the clusters for which the detection of a rotation pattern was more certain. Middle plot: same distribution, but including the clusters for which the rotation detection is much less certain – with the inclusion of these possible rotation cases, the age distribution of the clusters with detected rotation just seems to raise, without significantly changing its shape. Bottom plot: cluster age distribution for objects with some apparent pattern of contraction or expansion.
Current usage metrics show cumulative count of Article Views (full-text article views including HTML views, PDF and ePub downloads, according to the available data) and Abstracts Views on Vision4Press platform.
Data correspond to usage on the plateform after 2015. The current usage metrics is available 48-96 hours after online publication and is updated daily on week days.
Initial download of the metrics may take a while.