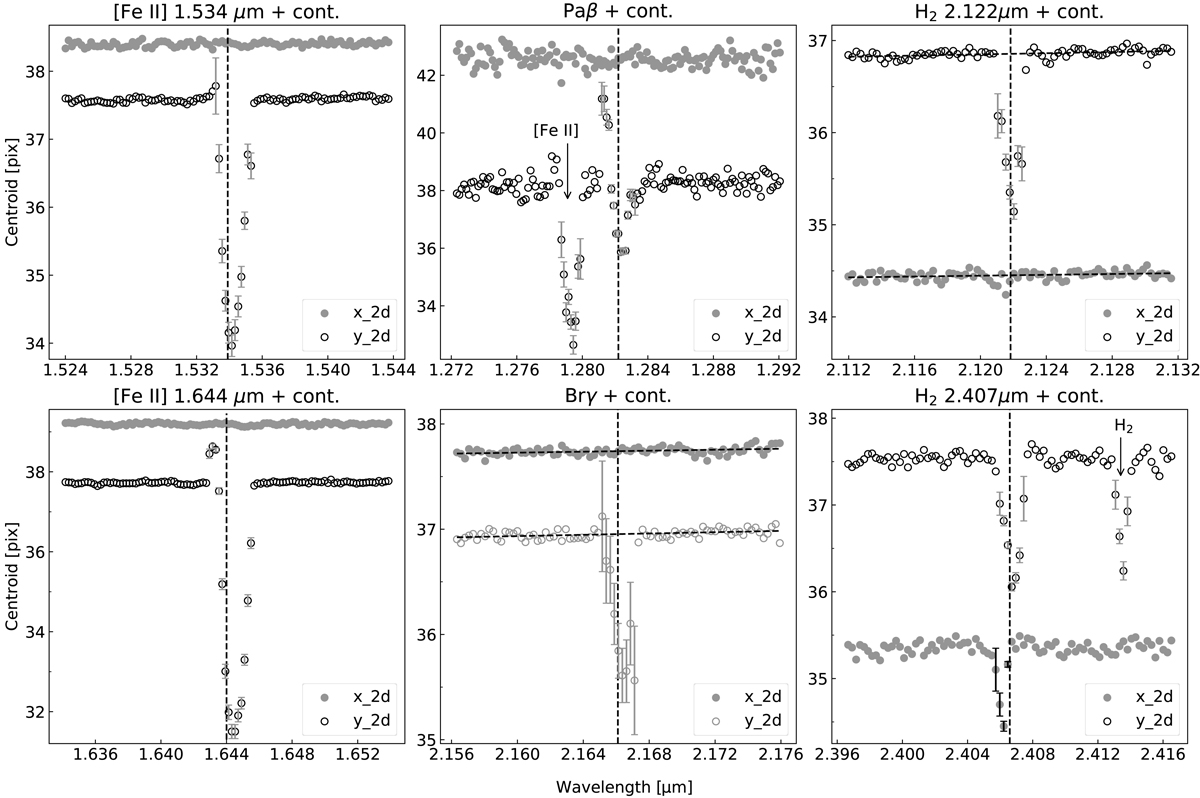
Fig. 8.
Download original image
Photocentre shift for [Fe II] 1.534, 1.644 μm, Paβ, Brγ, and H2 2.122, 2.406 μm along the XY-directions. The Y-direction is aligned with the jet axis, whereas the X-direction is orthogonal. The wavelength of spectral lines in the vacuum is indicated by vertical lines. On some plots, the values of centre coordinates are shifted as a whole in order to place both distributions on the same plot. The instrumental bias around Brγ, calculated from the continuum, was fit with a linear function (shown as dashed lines) and removed from further analysis. The shifts in the line cores were corrected for the line-to-continuum ratio, and the errors derived for the line centre displacement are shown. All the emission lines display a significant photocentre shift along the Y-direction (the direction of the jet), whereas the H2 lines also show a small shift in the orthogonal direction (X).
Current usage metrics show cumulative count of Article Views (full-text article views including HTML views, PDF and ePub downloads, according to the available data) and Abstracts Views on Vision4Press platform.
Data correspond to usage on the plateform after 2015. The current usage metrics is available 48-96 hours after online publication and is updated daily on week days.
Initial download of the metrics may take a while.