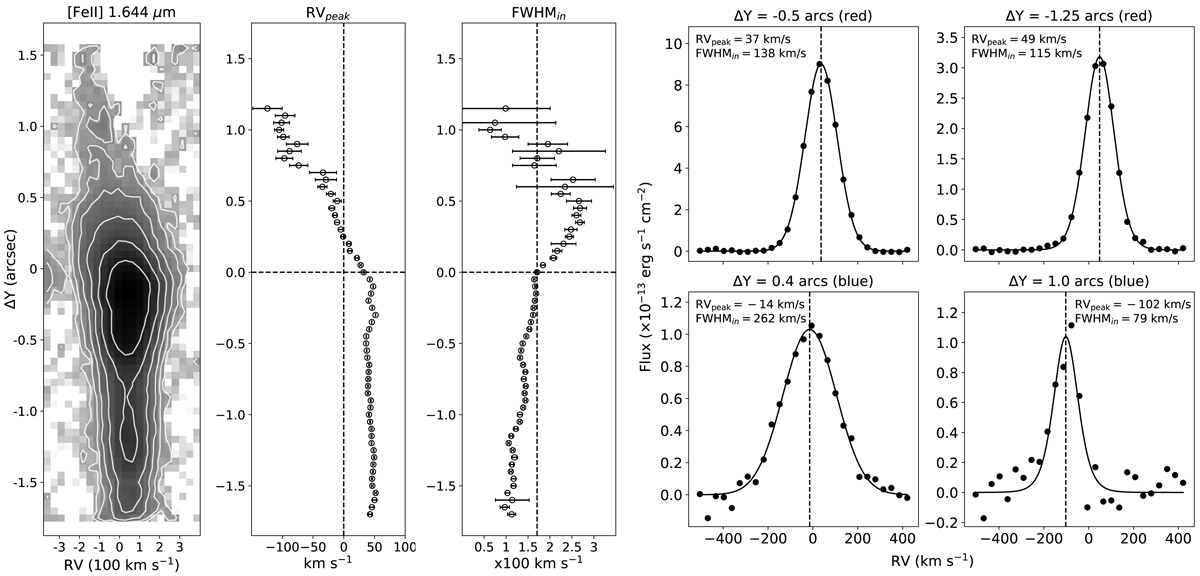
Fig. 6.
Download original image
Distribution of the [Fe II] 1.644 μm emission along the jet. Left image: PV diagrams of [Fe II] 1.644 μm line in the Th 28 jet, obtained by coadding fluxes in the 16 spectral frames across the jet. Logarithmic contours are drawn from 10−14 erg s−1 cm−2 arcsec−2 Å−1, with an incremental logarithmic step of 0.3 dex. Two central panels: RVpeak and FWHMin derived from fitting the PV diagram as a function of the distance from the source. The vertical line in the FWHM panel corresponds to 170 km s−1 measured for the position of the source. Right four panels: Spectral profiles across the jet at selected position in the blue and red lobes (black points). The data was fit using a Moffat function (solid line). The intrinsic FWHM and the peak RV are shown at the top of each panel.
Current usage metrics show cumulative count of Article Views (full-text article views including HTML views, PDF and ePub downloads, according to the available data) and Abstracts Views on Vision4Press platform.
Data correspond to usage on the plateform after 2015. The current usage metrics is available 48-96 hours after online publication and is updated daily on week days.
Initial download of the metrics may take a while.