Fig. 5.
Download original image
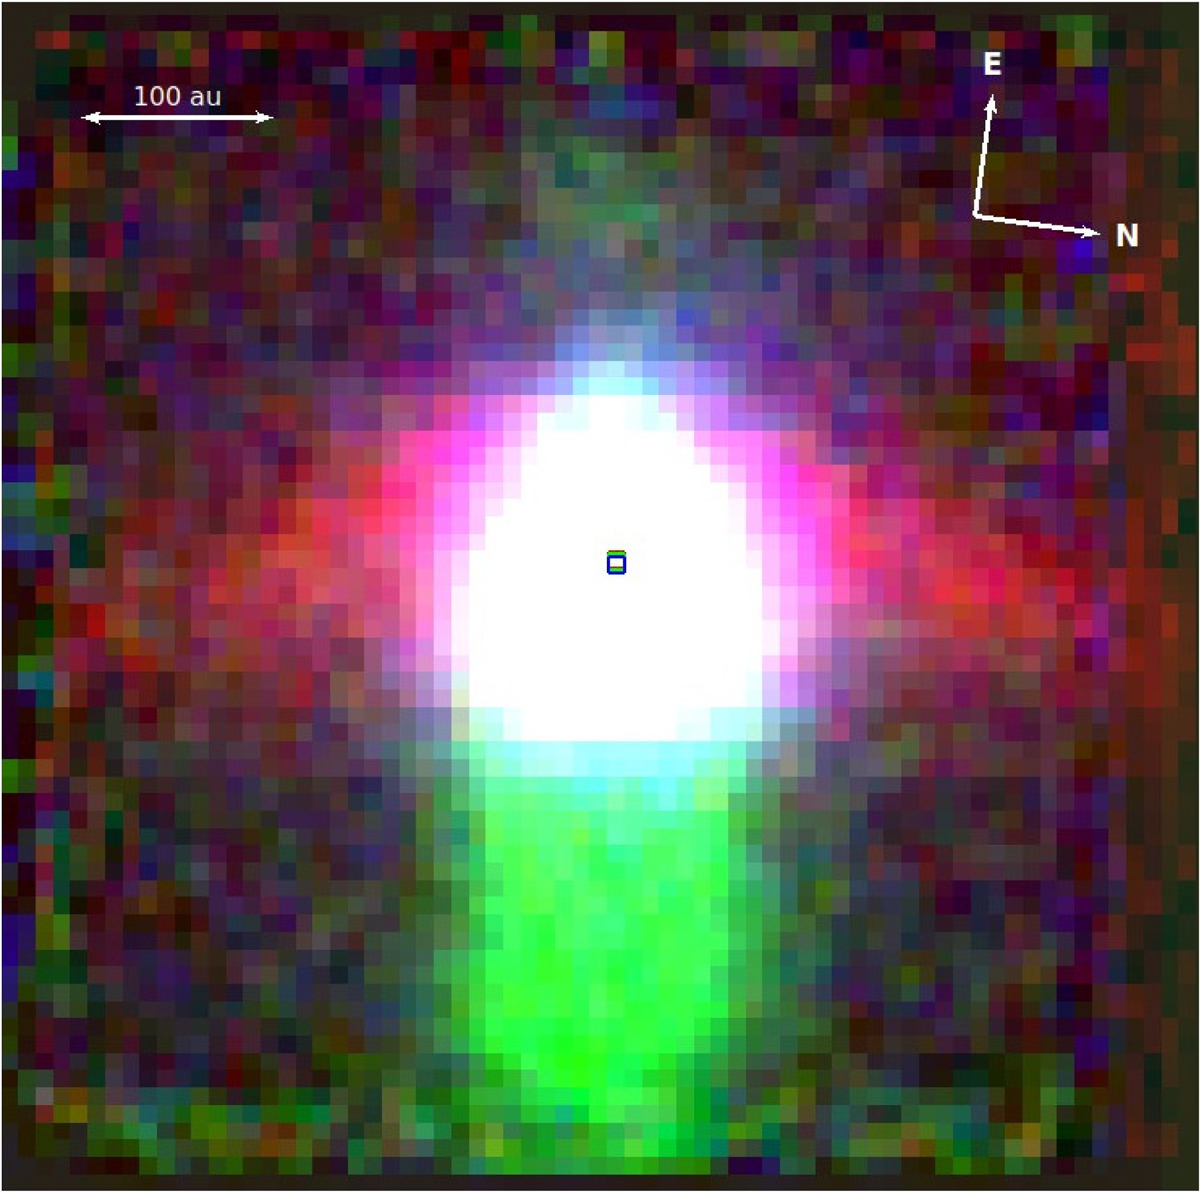
Tricolour map of the 3″ × 3″ field around Th 28, combined from three emission lines outlining different emission regions: blue (Paβ), green ([Fe II] 1.644 μm), and red (H2 2.122 μm). The plane of H2-emitting gas is clearly orthogonal to the position of jet axis outlined by forbidden [Fe II]-emission. Three small squares give the position of the star calculated from the continuum stellar profile.
Current usage metrics show cumulative count of Article Views (full-text article views including HTML views, PDF and ePub downloads, according to the available data) and Abstracts Views on Vision4Press platform.
Data correspond to usage on the plateform after 2015. The current usage metrics is available 48-96 hours after online publication and is updated daily on week days.
Initial download of the metrics may take a while.