Open Access
Fig. 4.
Download original image
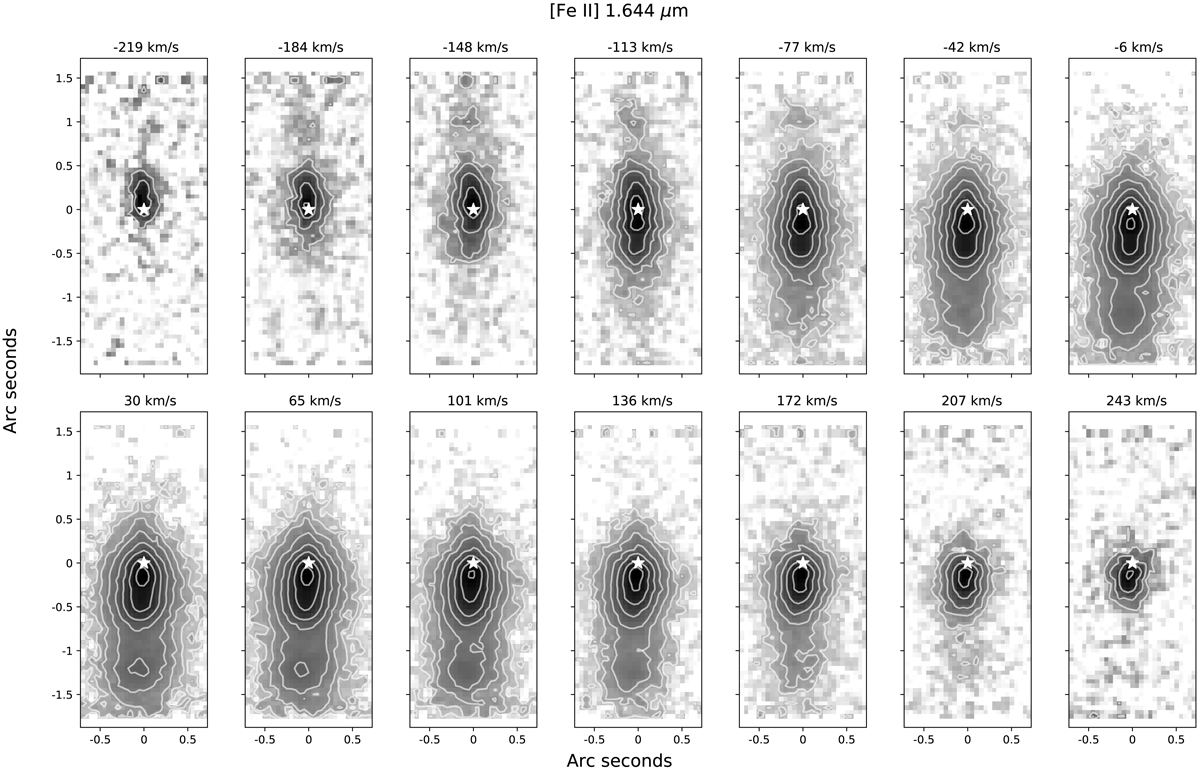
Continuum-subtracted channel maps for [Fe II] 1.644 μm. The 14 panels show that the [Fe II] emission covers a wavelength range from −220 km s−1 to 243 km s−1. The peak position of the continuum flux is indicated by a white star. Contours in units of erg s−1 cm−2 μm−1 consist of nine levels from 2 × 10⁻¹⁵ to 3.2 × 10⁻¹³.
Current usage metrics show cumulative count of Article Views (full-text article views including HTML views, PDF and ePub downloads, according to the available data) and Abstracts Views on Vision4Press platform.
Data correspond to usage on the plateform after 2015. The current usage metrics is available 48-96 hours after online publication and is updated daily on week days.
Initial download of the metrics may take a while.