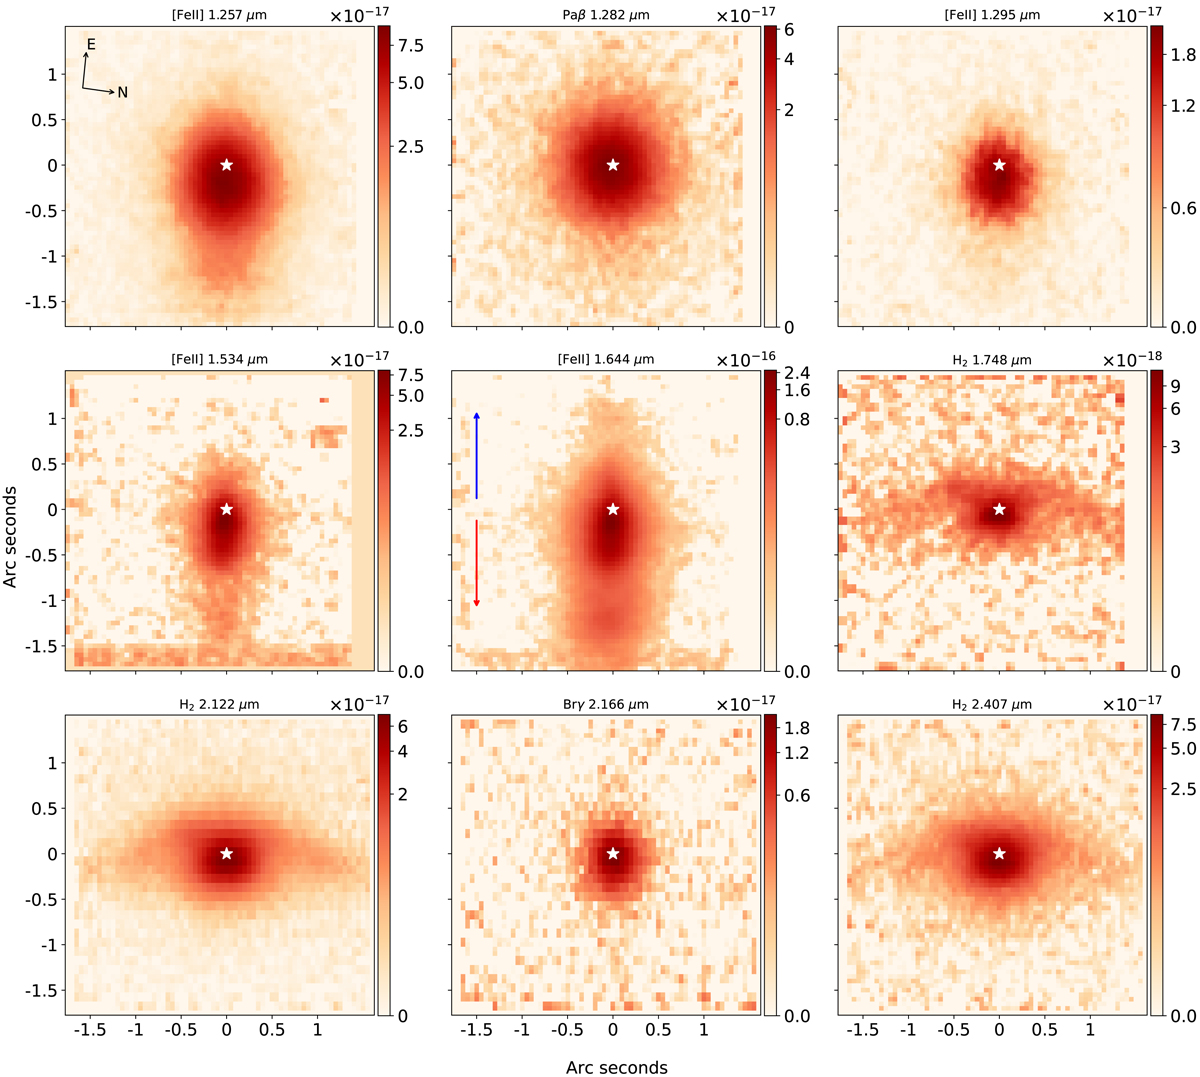
Fig. 3.
Download original image
Total line flux maps of the nine brightest emission lines in Th 28 over the J, H, and K bands. Each map shows the total line flux integrated over all the velocity frames where emission is detected. The star gives the position of the central source, calculated from the continuum (stellar) profile. The coloured arrows indicate the direction of the blue and red lobes. The vertical log-scale shows the fluxes in erg s−1 cm−2.
Current usage metrics show cumulative count of Article Views (full-text article views including HTML views, PDF and ePub downloads, according to the available data) and Abstracts Views on Vision4Press platform.
Data correspond to usage on the plateform after 2015. The current usage metrics is available 48-96 hours after online publication and is updated daily on week days.
Initial download of the metrics may take a while.