Fig. 11.
Download original image
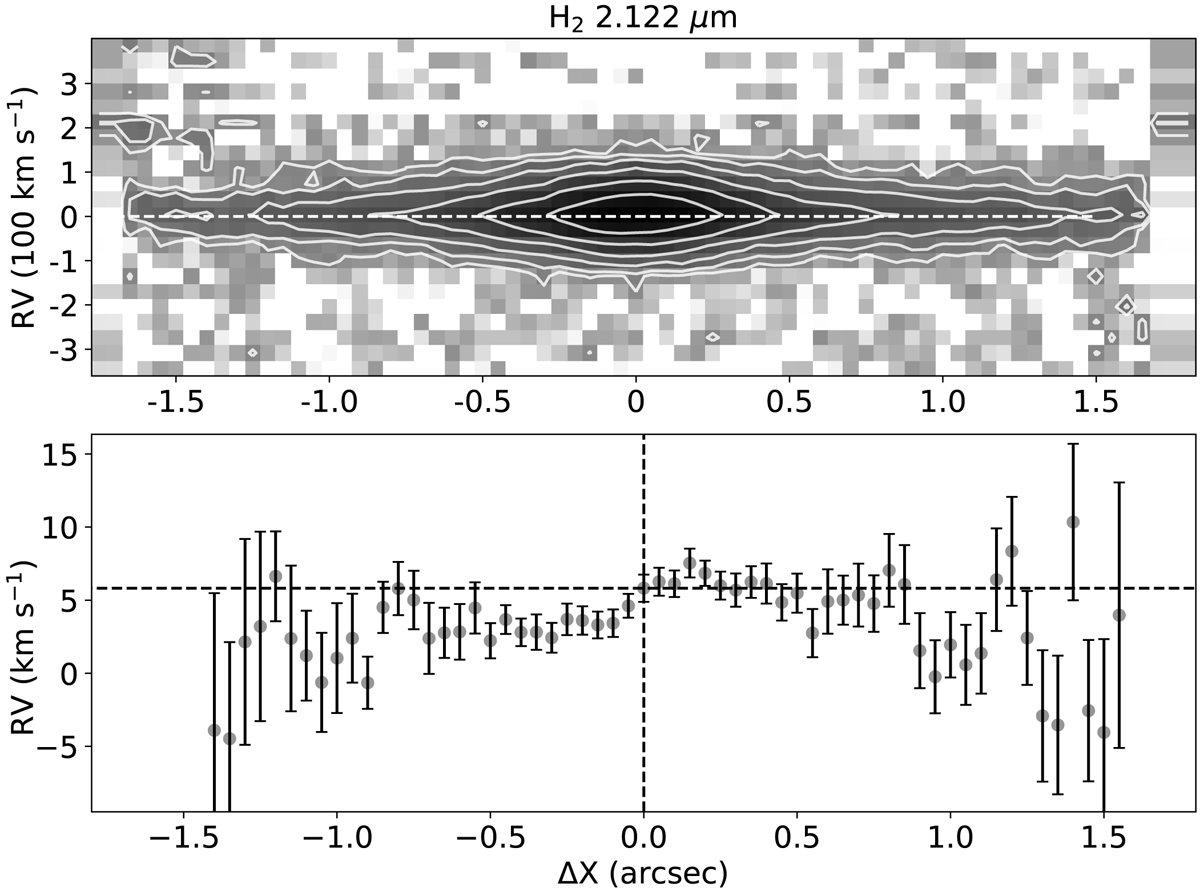
Distribution of the H2 2.122 μm emission in the disc plane. Upper panel: PV diagram of the H2 2.122 μm line perpendicular to the direction of the jet axis and in the disc plane. Lower panel: Peak radial velocities with error bars computed from fitting across the PV diagram at the every position with 0![]() 05 steps. The region from
05 steps. The region from ![]() to
to ![]() around position at 0″ corresponds to the bright core of H2 emission around the jet source.
around position at 0″ corresponds to the bright core of H2 emission around the jet source.
Current usage metrics show cumulative count of Article Views (full-text article views including HTML views, PDF and ePub downloads, according to the available data) and Abstracts Views on Vision4Press platform.
Data correspond to usage on the plateform after 2015. The current usage metrics is available 48-96 hours after online publication and is updated daily on week days.
Initial download of the metrics may take a while.