Open Access
Fig. 6.
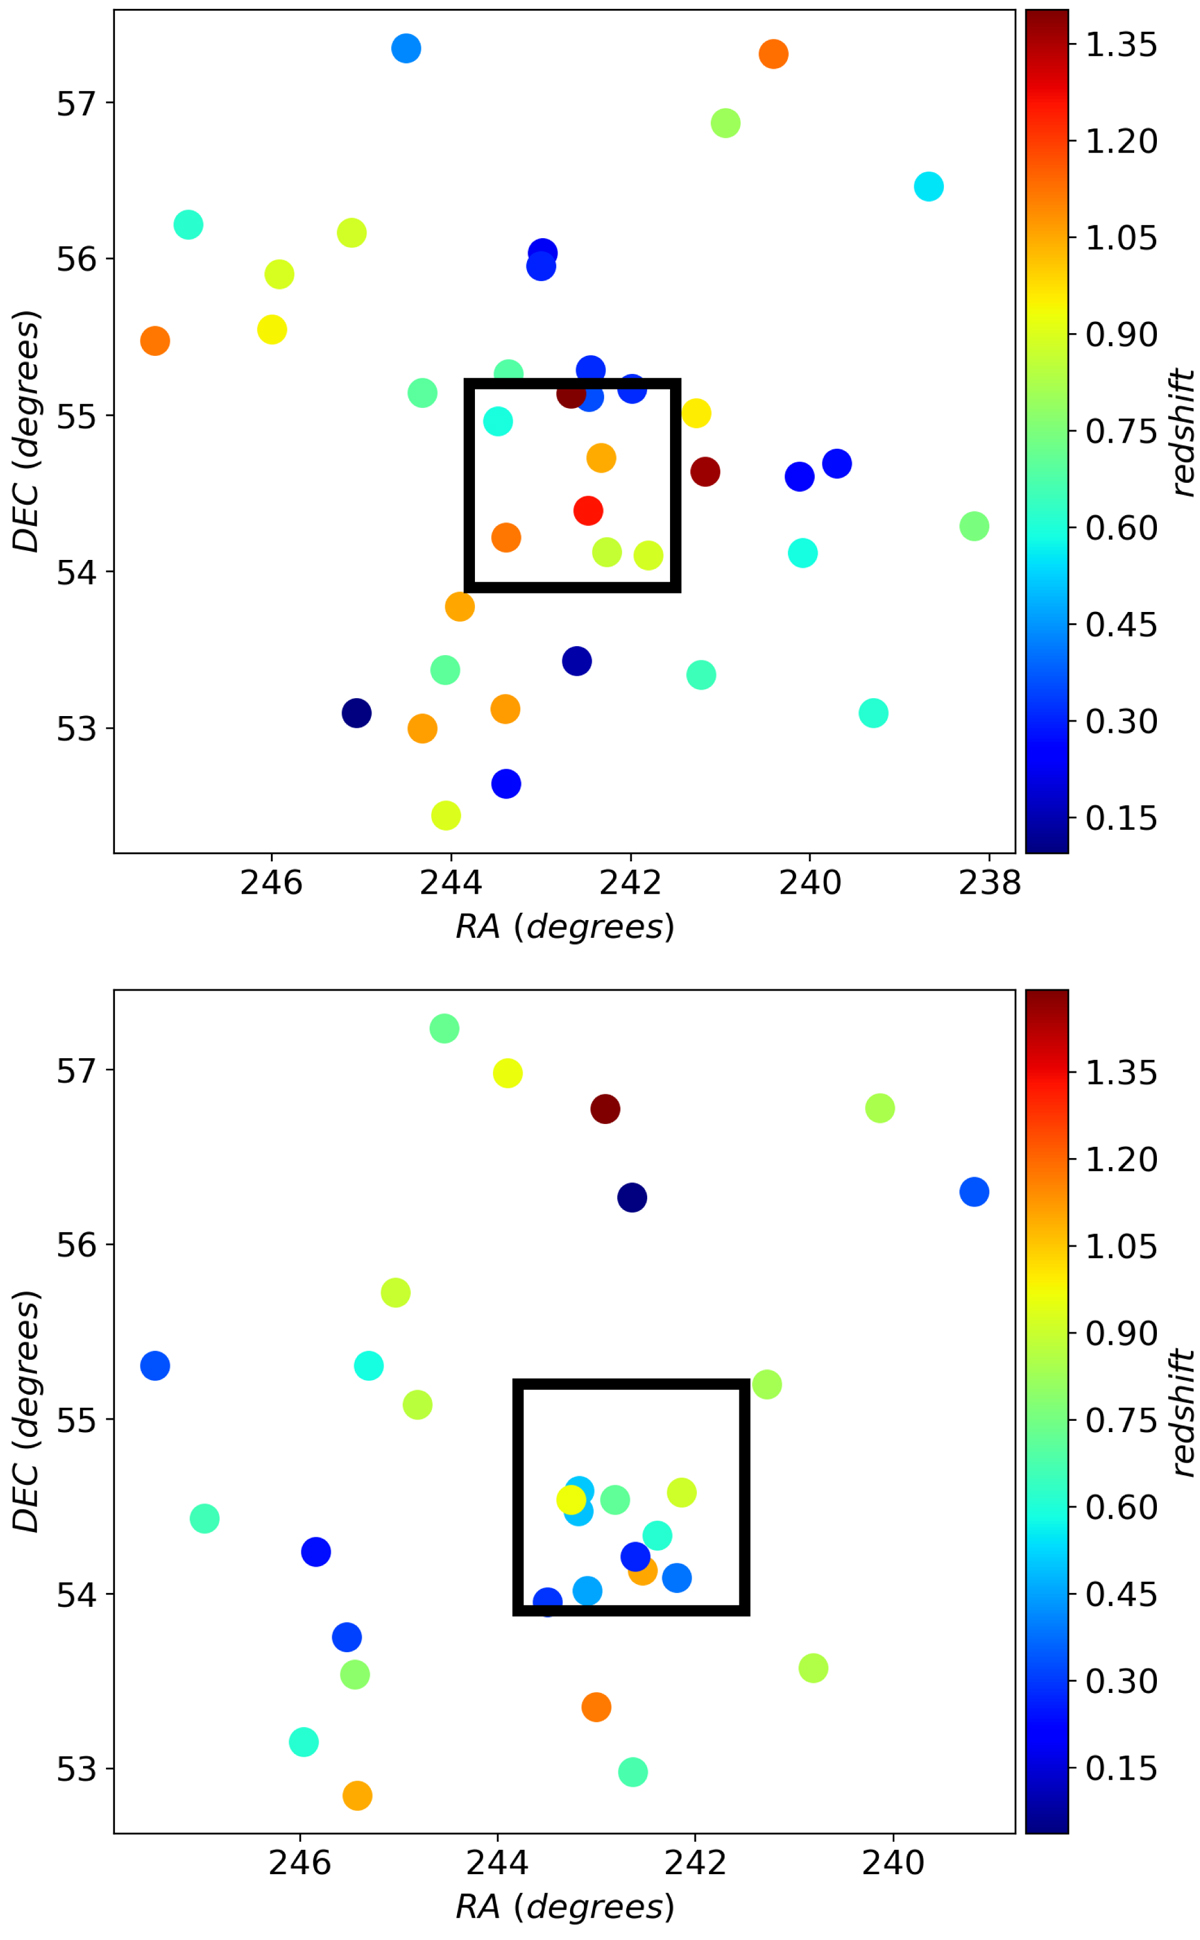
Download original image
Spatial distribution of 39 ERGs with RPA between 50° and 60° (upper panel) and 31 ERGs with RPA in the range 140° −150°. The colour bar shows the redshifts of the ERGs. The analysis was restricted to z ≤ 1.5. The black box represents the field of Taylor & Jagannathan (2016).
Current usage metrics show cumulative count of Article Views (full-text article views including HTML views, PDF and ePub downloads, according to the available data) and Abstracts Views on Vision4Press platform.
Data correspond to usage on the plateform after 2015. The current usage metrics is available 48-96 hours after online publication and is updated daily on week days.
Initial download of the metrics may take a while.