Fig. 5.
Download original image
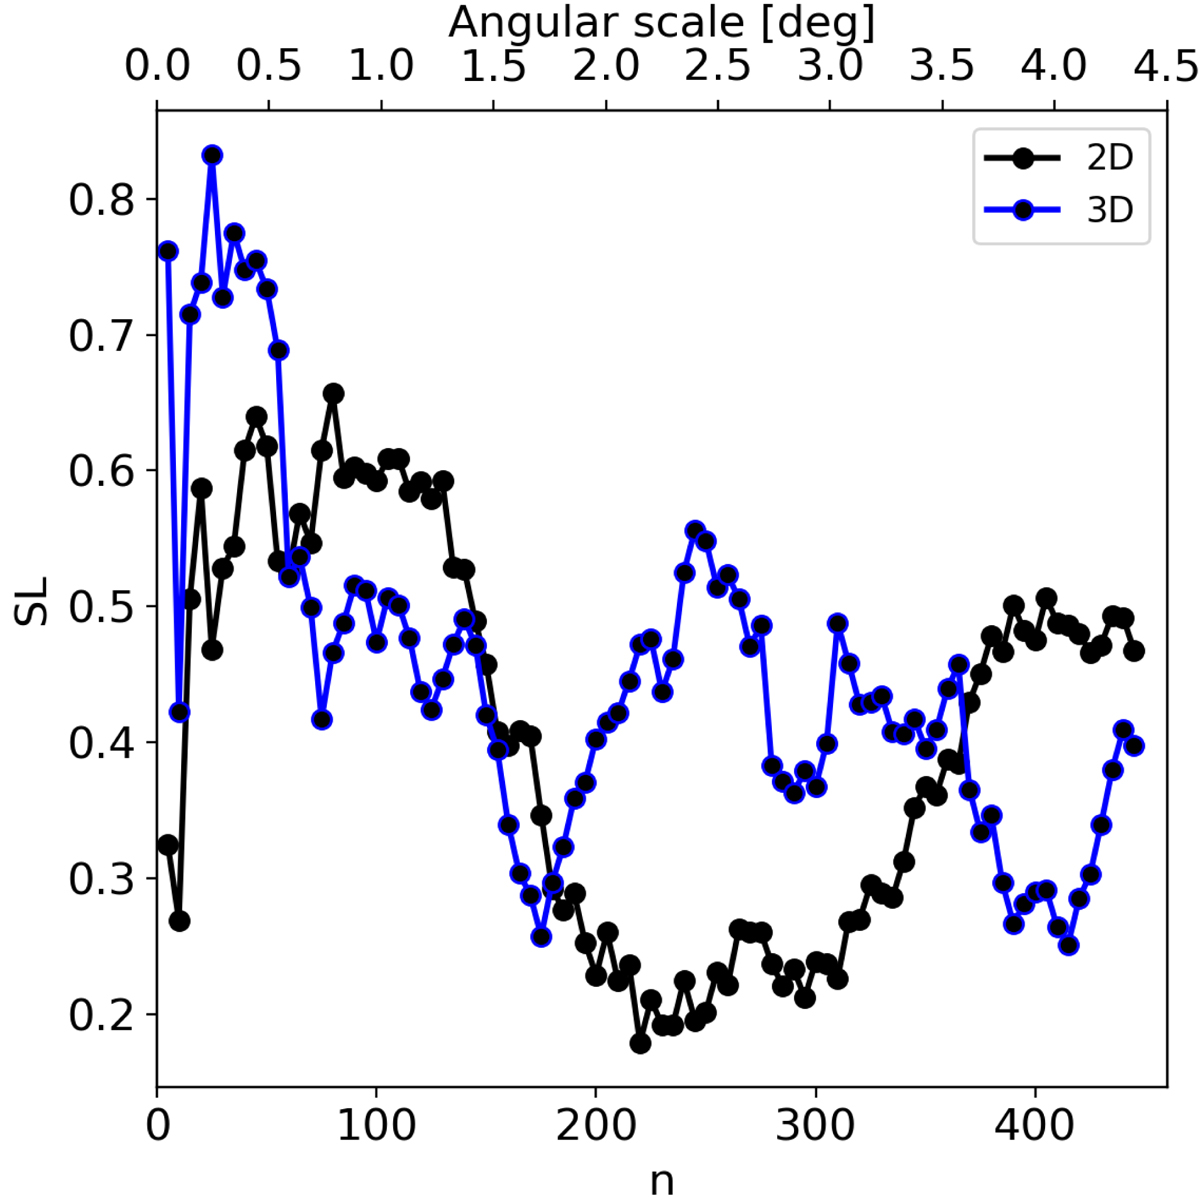
Significance level of the dispersion measure test (SL) as a function of the nearest neighbours (n, lower abscissa) and angular scale in degrees (upper abscissa). The black line shows the results of the 2D analysis while the 3D analysis is shown with the blue line. Such a large SL (≫0.03) shows that no alignment is present in the ELAIS-N1 field at any scale in our analysis.
Current usage metrics show cumulative count of Article Views (full-text article views including HTML views, PDF and ePub downloads, according to the available data) and Abstracts Views on Vision4Press platform.
Data correspond to usage on the plateform after 2015. The current usage metrics is available 48-96 hours after online publication and is updated daily on week days.
Initial download of the metrics may take a while.