Open Access
Fig. 1.
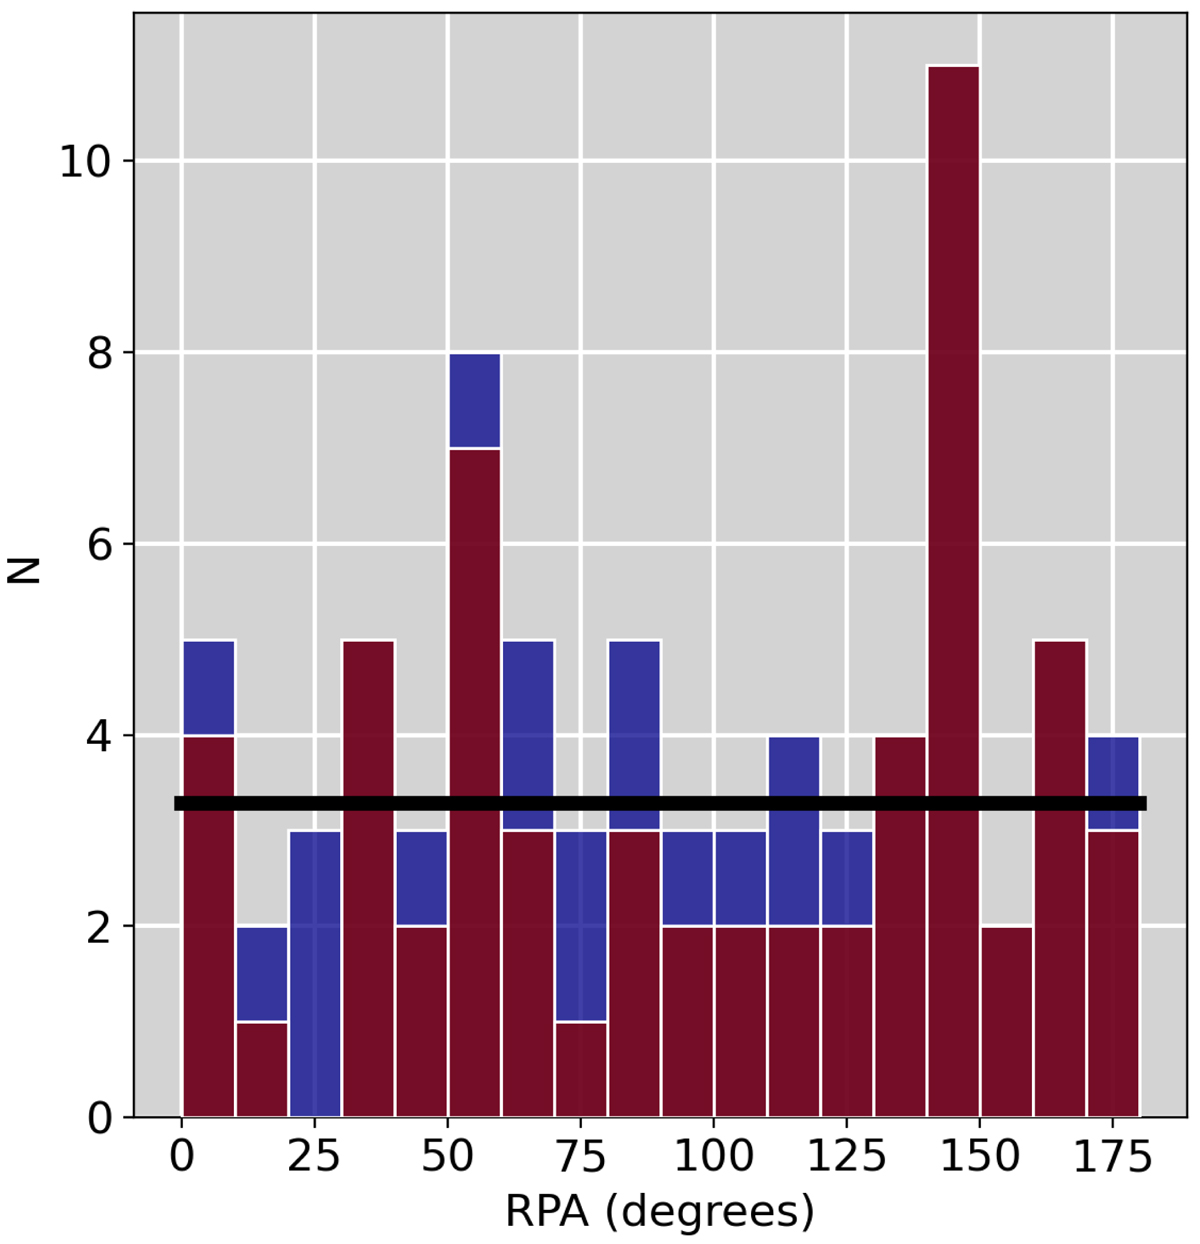
Download original image
Distribution of the RPAs of the 78 ERGs (blue histogram) that we found in the inner region of the ELDF and of the 59 certain sources (red histogram). The black line shows the expected number of objects per bin for a uniform distribution of 78 ERGs.
Current usage metrics show cumulative count of Article Views (full-text article views including HTML views, PDF and ePub downloads, according to the available data) and Abstracts Views on Vision4Press platform.
Data correspond to usage on the plateform after 2015. The current usage metrics is available 48-96 hours after online publication and is updated daily on week days.
Initial download of the metrics may take a while.