Open Access
Fig. 8.
Download original image
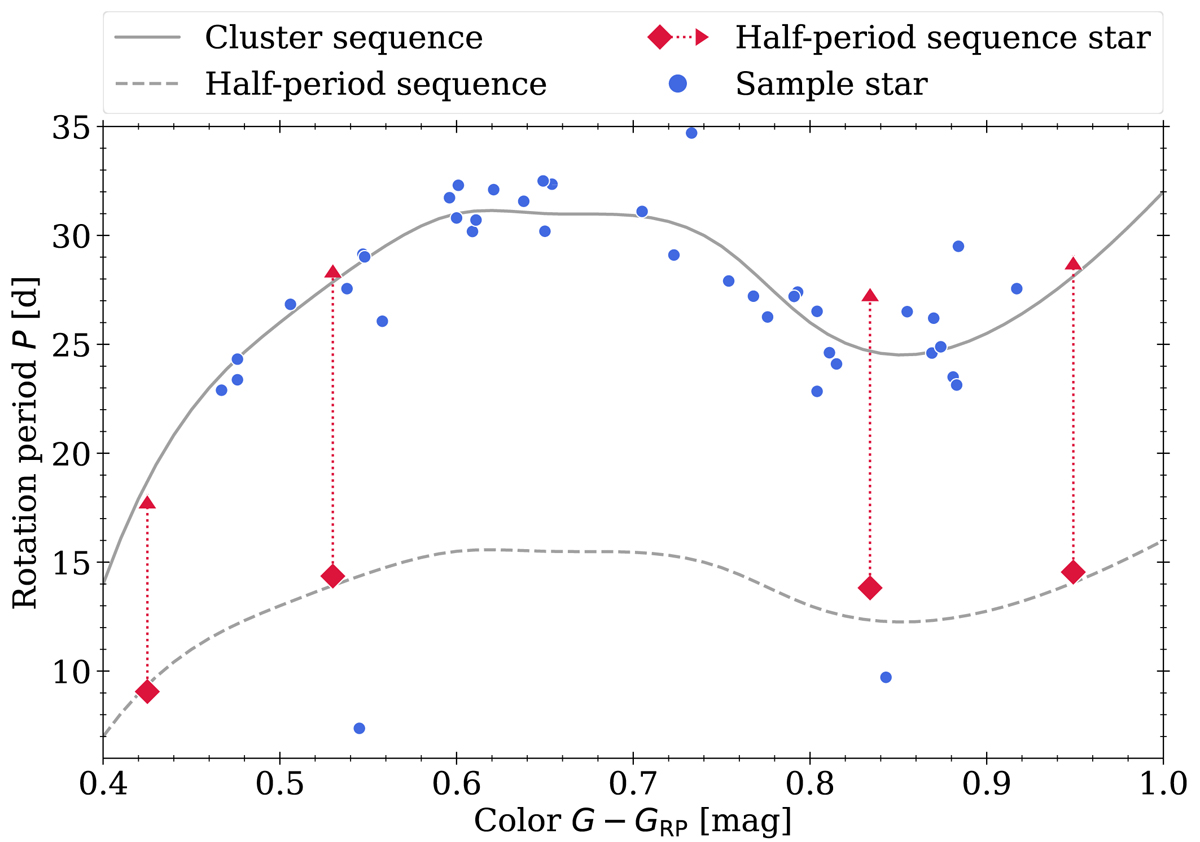
CPD for our M 67 sample emphasizing stars on the half-period sequence. The cluster sequence, approximated by an interpolated line, is overplotted in gray. The dashed line shows its half-period counterpart. Stars for which we double the measured periods (red) are connected to their new positions by dashed lines.
Current usage metrics show cumulative count of Article Views (full-text article views including HTML views, PDF and ePub downloads, according to the available data) and Abstracts Views on Vision4Press platform.
Data correspond to usage on the plateform after 2015. The current usage metrics is available 48-96 hours after online publication and is updated daily on week days.
Initial download of the metrics may take a while.