Open Access
Fig. 7.
Download original image
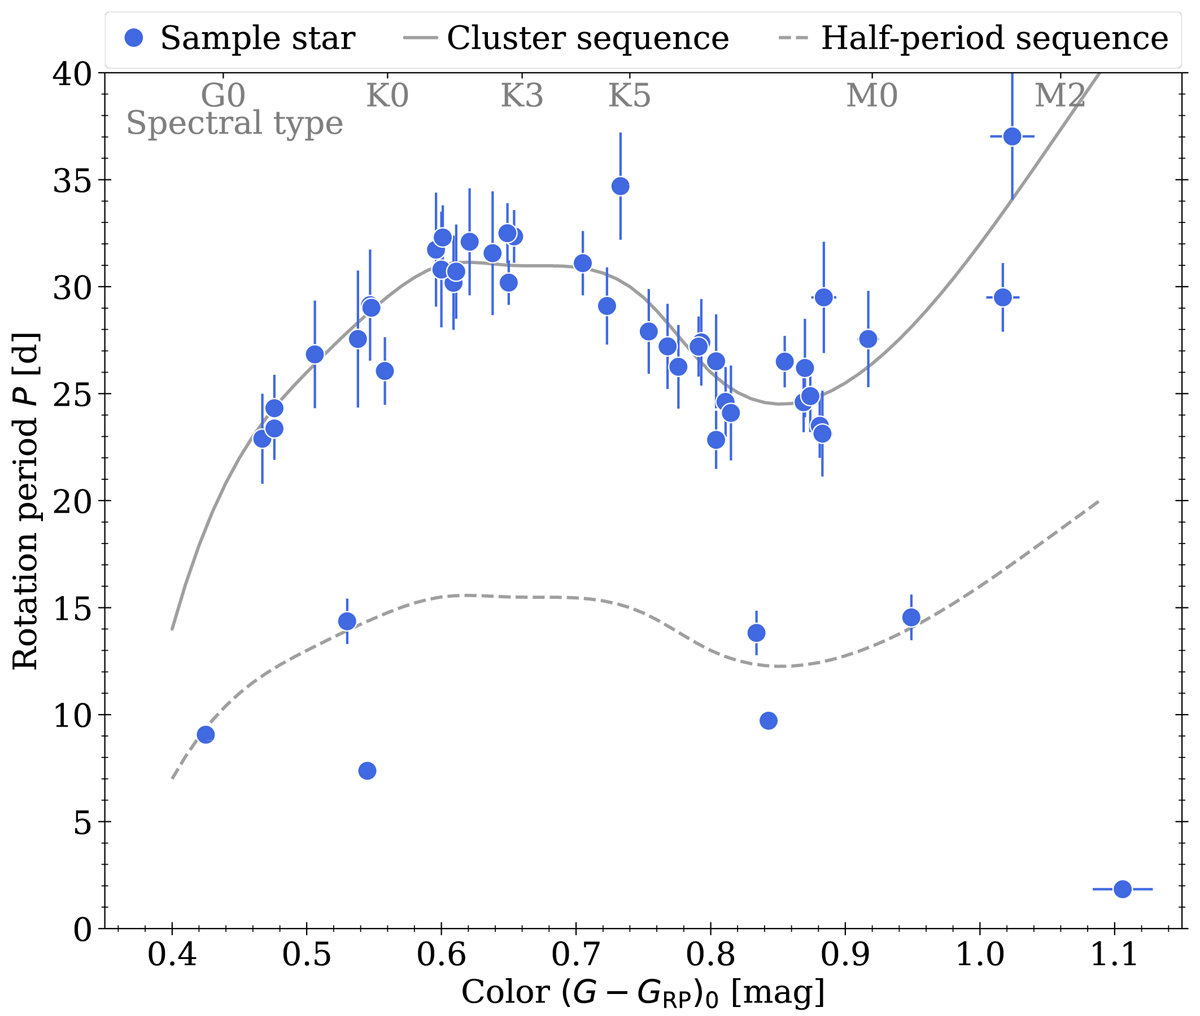
Color-period diagram for our sample, now including rotation period uncertainties. Only member stars on the main sequence, and with no indications of binarity are displayed. An approximation of the emerging cluster distribution (solid gray line) is overplotted, together with its half-period counterpart (dashed line).
Current usage metrics show cumulative count of Article Views (full-text article views including HTML views, PDF and ePub downloads, according to the available data) and Abstracts Views on Vision4Press platform.
Data correspond to usage on the plateform after 2015. The current usage metrics is available 48-96 hours after online publication and is updated daily on week days.
Initial download of the metrics may take a while.