Fig. 5.
Download original image
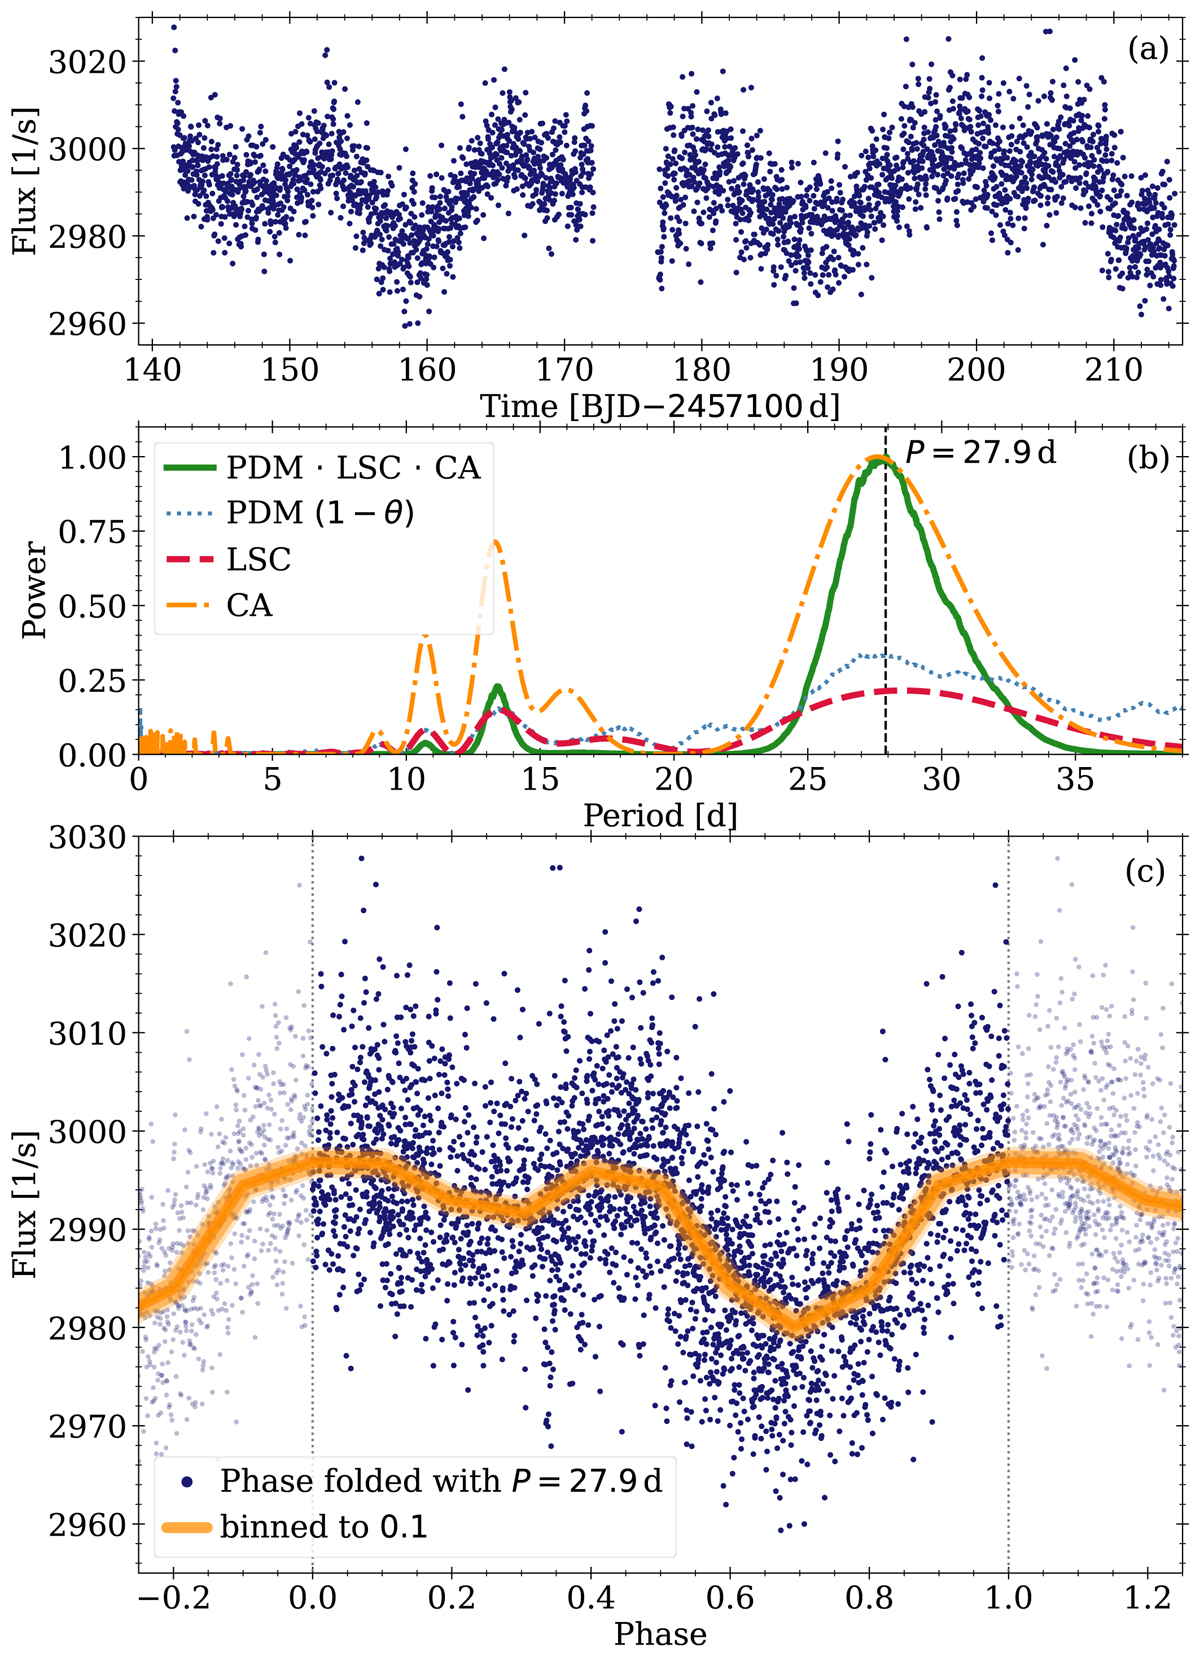
Result of period analysis on the light curve for Gaia DR3 604971466769552128. Panel a shows the light curve produced, one which exhibits a clear periodic signal. The power spectra in panel b are obtained using multiple methods as indicated. The Clean (CA) and Combined power spectra are normalized to their maxima and the PDM spectrum is shown as 1 − θ. Panel c shows the phase-folded light curve, folded with P = 27.9 d, corresponding to the peak in the combined spectrum.
Current usage metrics show cumulative count of Article Views (full-text article views including HTML views, PDF and ePub downloads, according to the available data) and Abstracts Views on Vision4Press platform.
Data correspond to usage on the plateform after 2015. The current usage metrics is available 48-96 hours after online publication and is updated daily on week days.
Initial download of the metrics may take a while.