Fig. 4.
Download original image
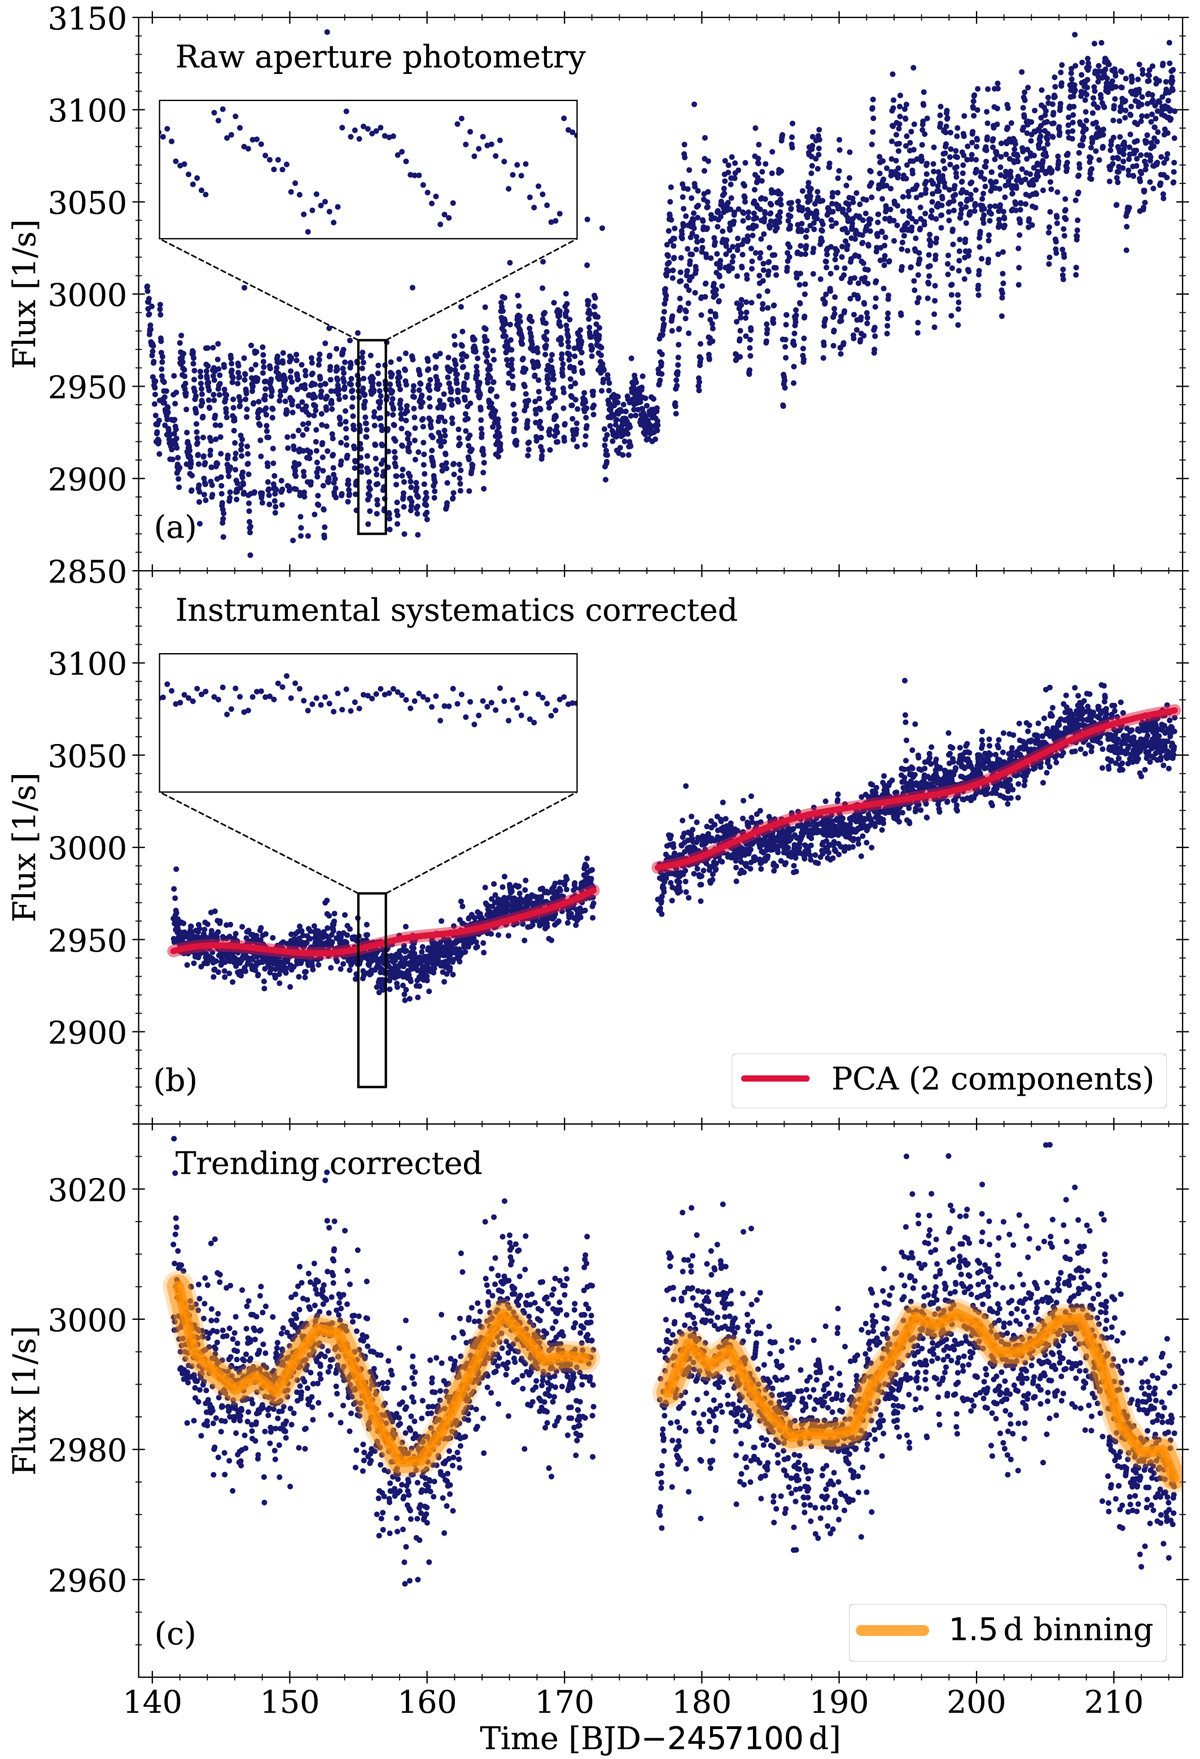
Example of the light curve reduction process using Gaia DR3 604971466769552128. Panel a shows the raw light curve (blue dots), panel b shows an intermediate light curve after the systematics correction (blue dots) together with the PCA correction (red) that is applied to the create the final reduced light curve that is shown in panel c. The orange line in panel c shows the reduced light curve with 1.5 d binning to highlight the now visible intrinsic stellar variability. The insets in a and b zoom in on a 2 d span of the light curve. The drift-induced flux changes and the jumps caused by the realignment of the telescope are readily visible in panel a, while their disappearance can be seen in panel b.
Current usage metrics show cumulative count of Article Views (full-text article views including HTML views, PDF and ePub downloads, according to the available data) and Abstracts Views on Vision4Press platform.
Data correspond to usage on the plateform after 2015. The current usage metrics is available 48-96 hours after online publication and is updated daily on week days.
Initial download of the metrics may take a while.