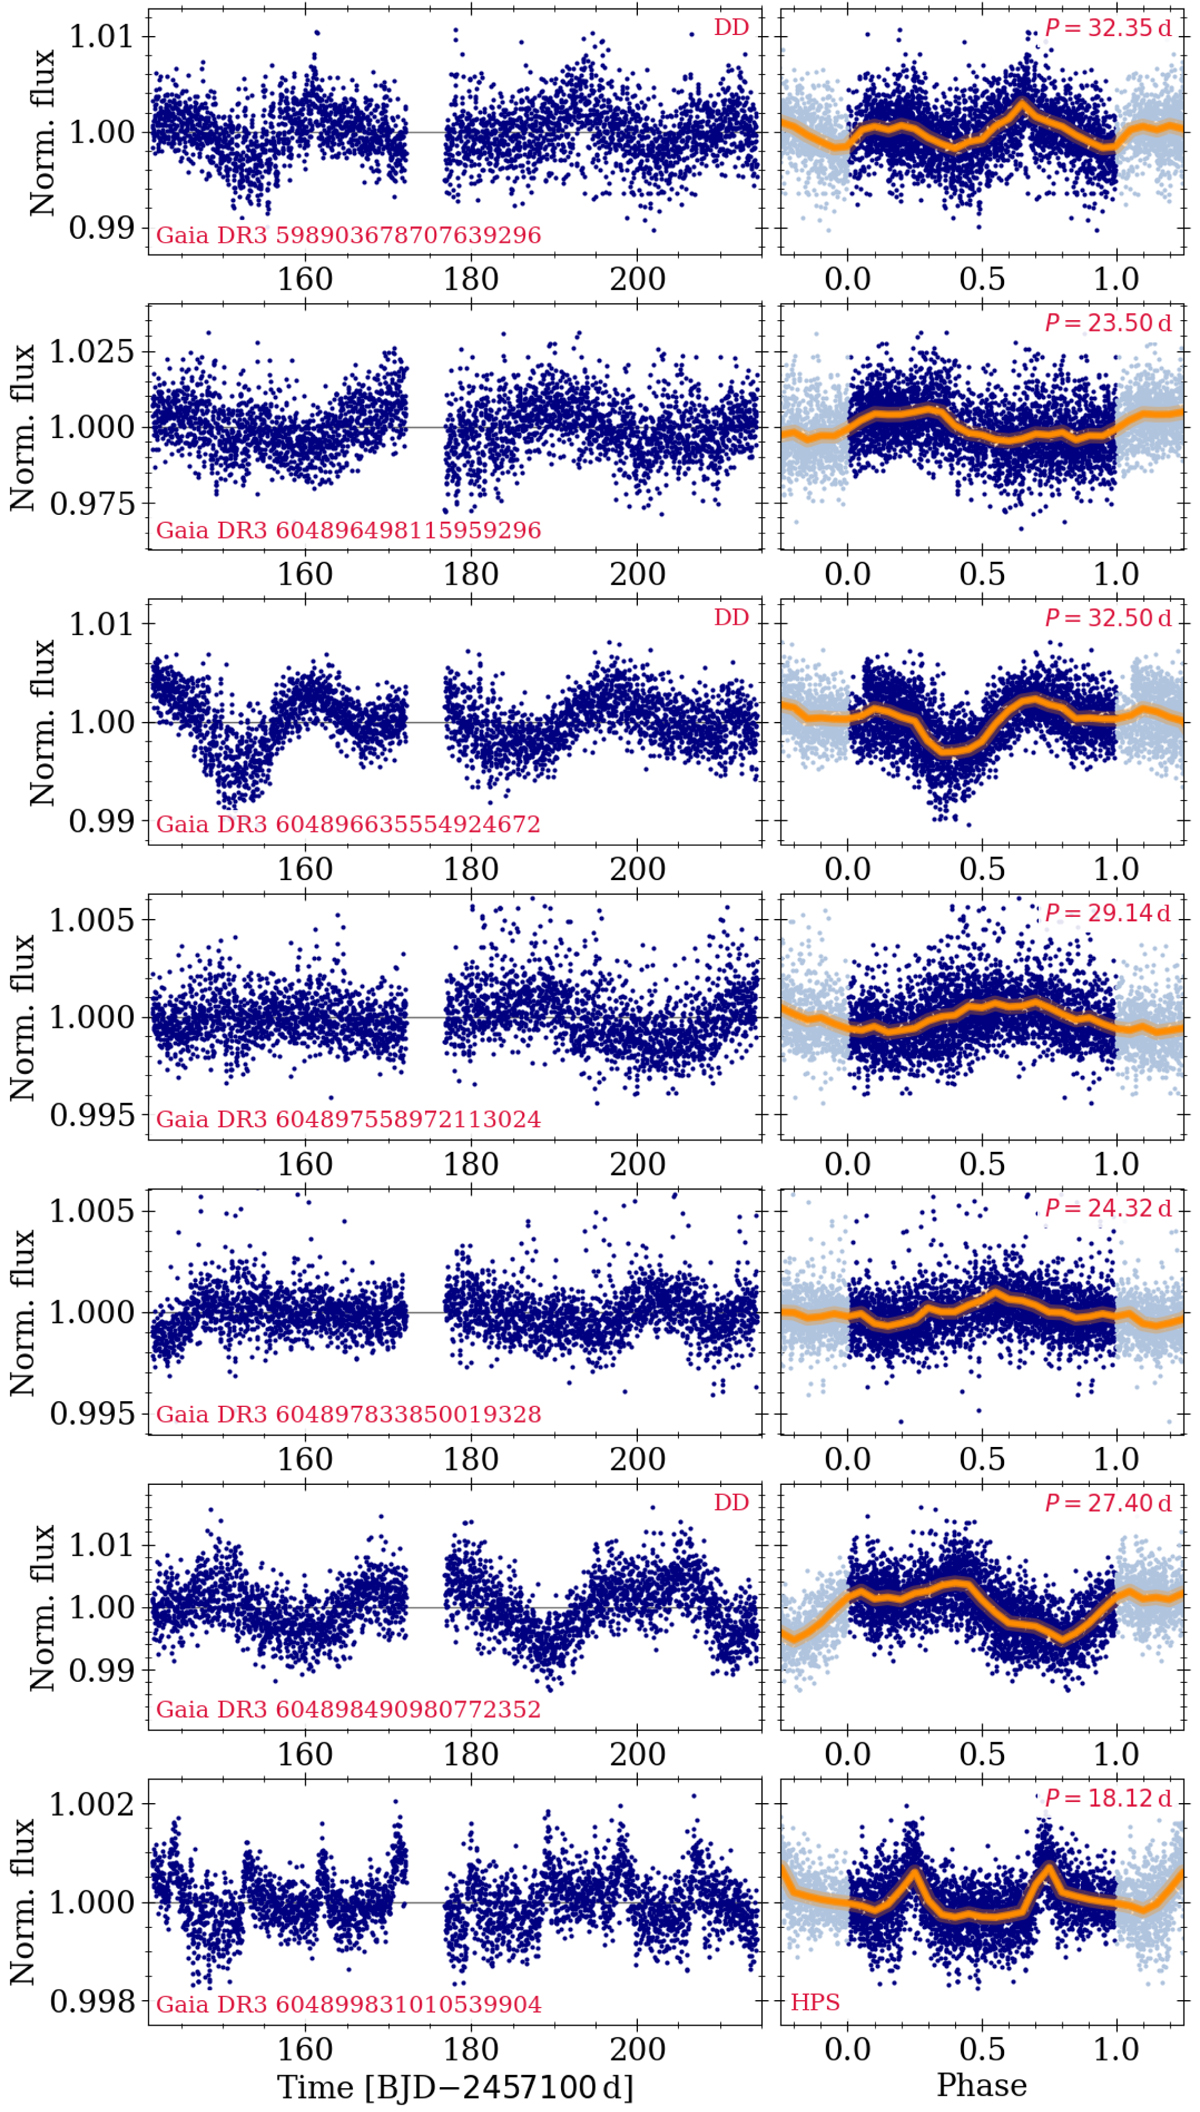
Fig. C.4.
Download original image
Light curves for our sample stars. Each row in the figure is a star, with the name indicated. The left panel shows the light curve, the right panel their phase folded counterparts. The period used for the phase folding is shown in the upper right. The light curve panel displays the Gaia DR3 id in the lower left corner. Additional labels indicate whether a star’s light curve exhibits multiple spot features, i.e., is double dipping (DD, upper right corner in the left panel) or is a member of the half-period sequence (HPS, lower left corner of the right panel). The orange line indicates a 0.01 binning. Note that double dipping refers to all stars whose light curves exhibit signs of more than one spot. Stars are sorted as in Table C.2, by their Gaia Id.
Current usage metrics show cumulative count of Article Views (full-text article views including HTML views, PDF and ePub downloads, according to the available data) and Abstracts Views on Vision4Press platform.
Data correspond to usage on the plateform after 2015. The current usage metrics is available 48-96 hours after online publication and is updated daily on week days.
Initial download of the metrics may take a while.