Fig. B.14.
Download original image
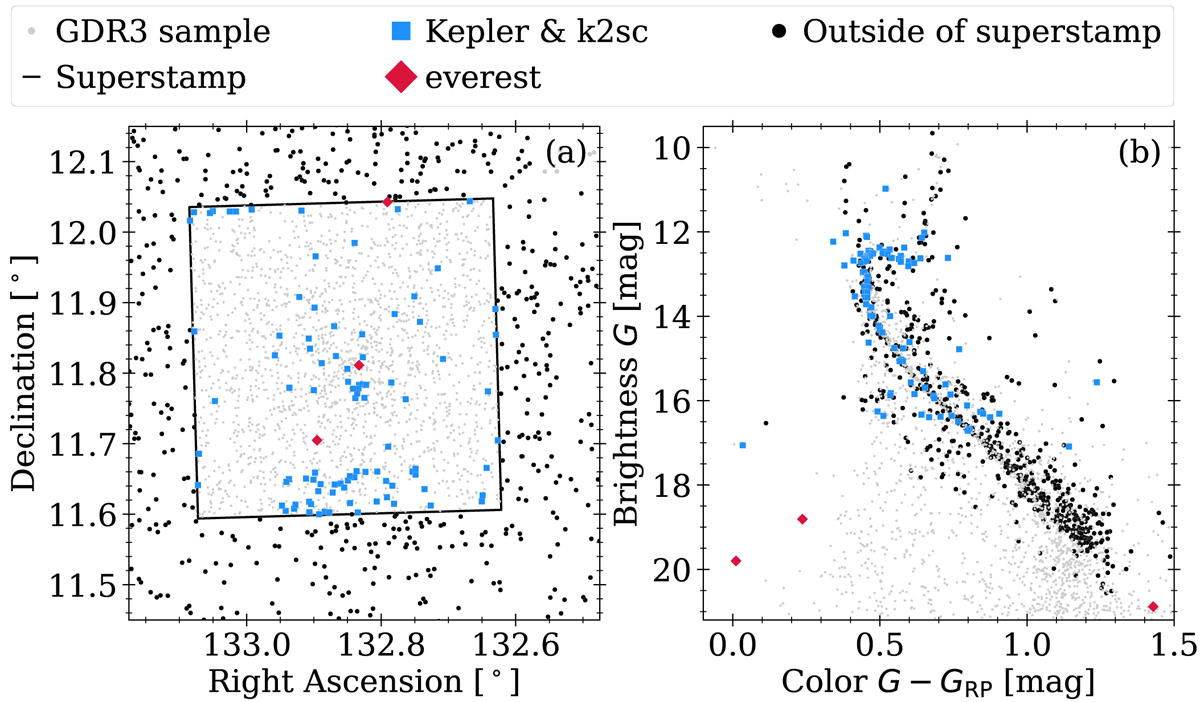
Spatial distribution of stars with available light curves in the archives for different data products. Panel (a) shows a map centered on M67 with the extent of the superstamp indicated (black box). Targets with archived light curves within (red and blue) and outside (black) of superstamp are overplotted. Panel (b) shows the same stars in a CMD.
Current usage metrics show cumulative count of Article Views (full-text article views including HTML views, PDF and ePub downloads, according to the available data) and Abstracts Views on Vision4Press platform.
Data correspond to usage on the plateform after 2015. The current usage metrics is available 48-96 hours after online publication and is updated daily on week days.
Initial download of the metrics may take a while.