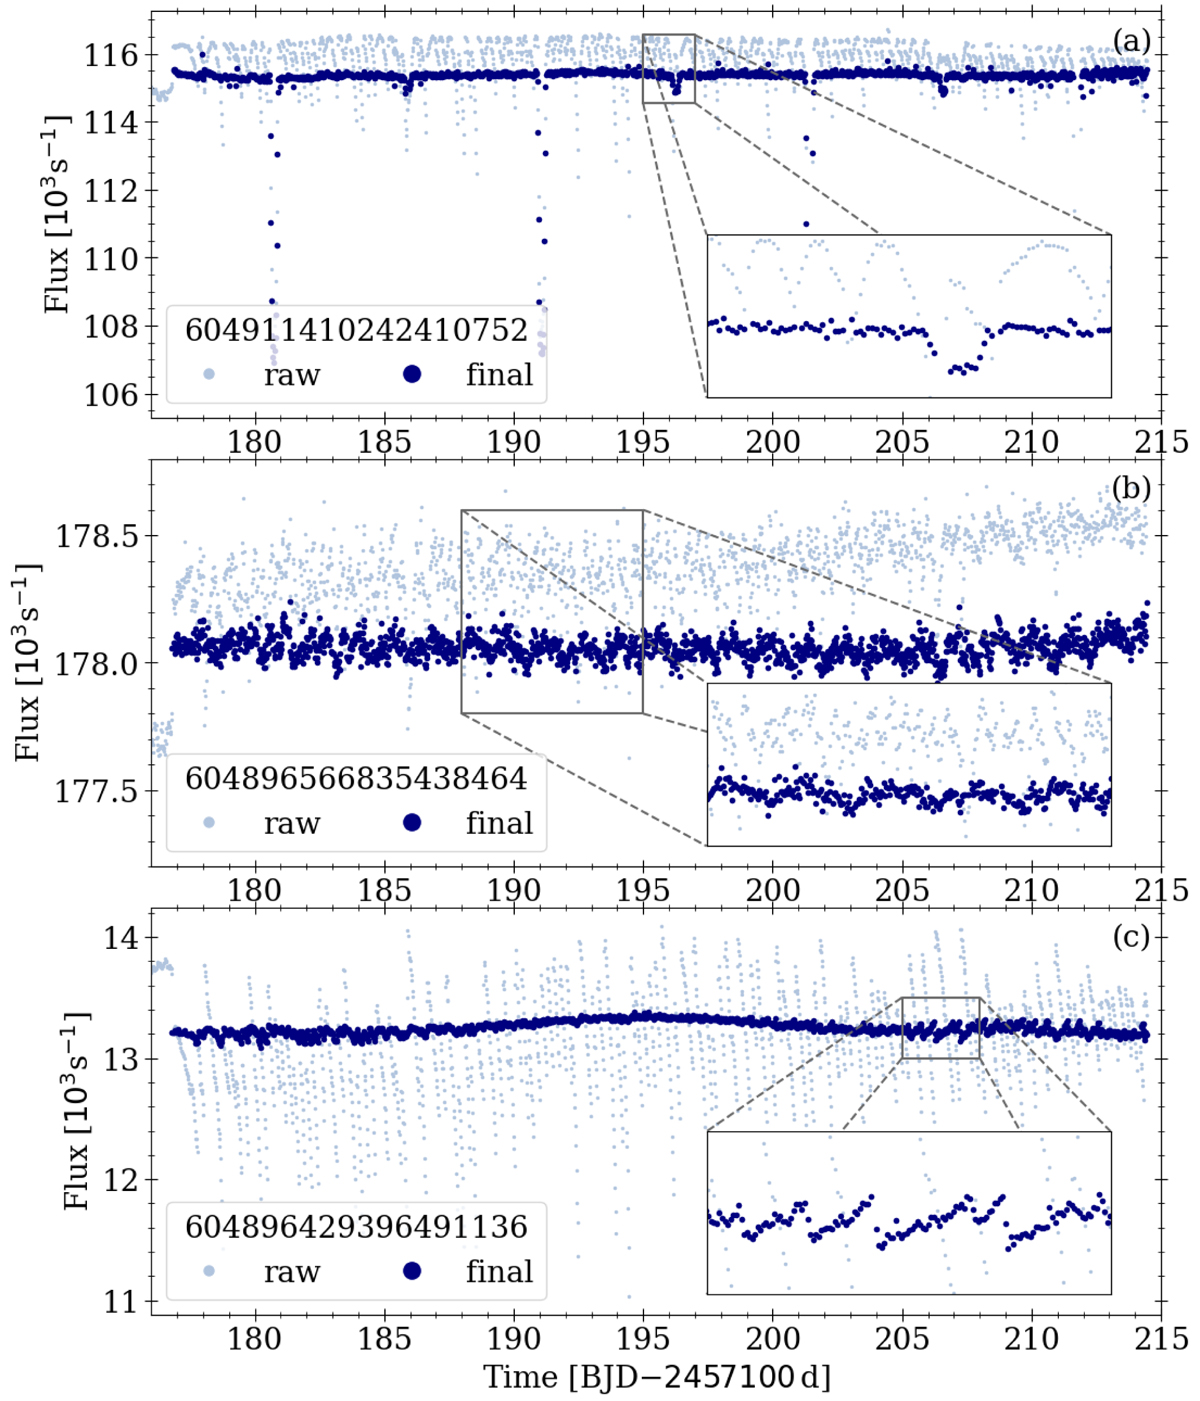
Fig. B.13.
Download original image
Example light curves illustrating the capabilities and limitations of our correction process. Panel (a) shows the light curve of an eclipsing binary with a significant primary eclipse and a secondary eclipse that only becomes really apparent after the correction was carried out. Panel (b) shows a star where the instrumental systematics completely obscure the intrinsic signal despite their being of comparable amplitude. Panel (c) shows the light curve of a star located at the edge of the superstamp and which suffers from artifacts created by the correction process as a consequence. Each panel includes highlighted regions to show the details of the relevant effects.
Current usage metrics show cumulative count of Article Views (full-text article views including HTML views, PDF and ePub downloads, according to the available data) and Abstracts Views on Vision4Press platform.
Data correspond to usage on the plateform after 2015. The current usage metrics is available 48-96 hours after online publication and is updated daily on week days.
Initial download of the metrics may take a while.