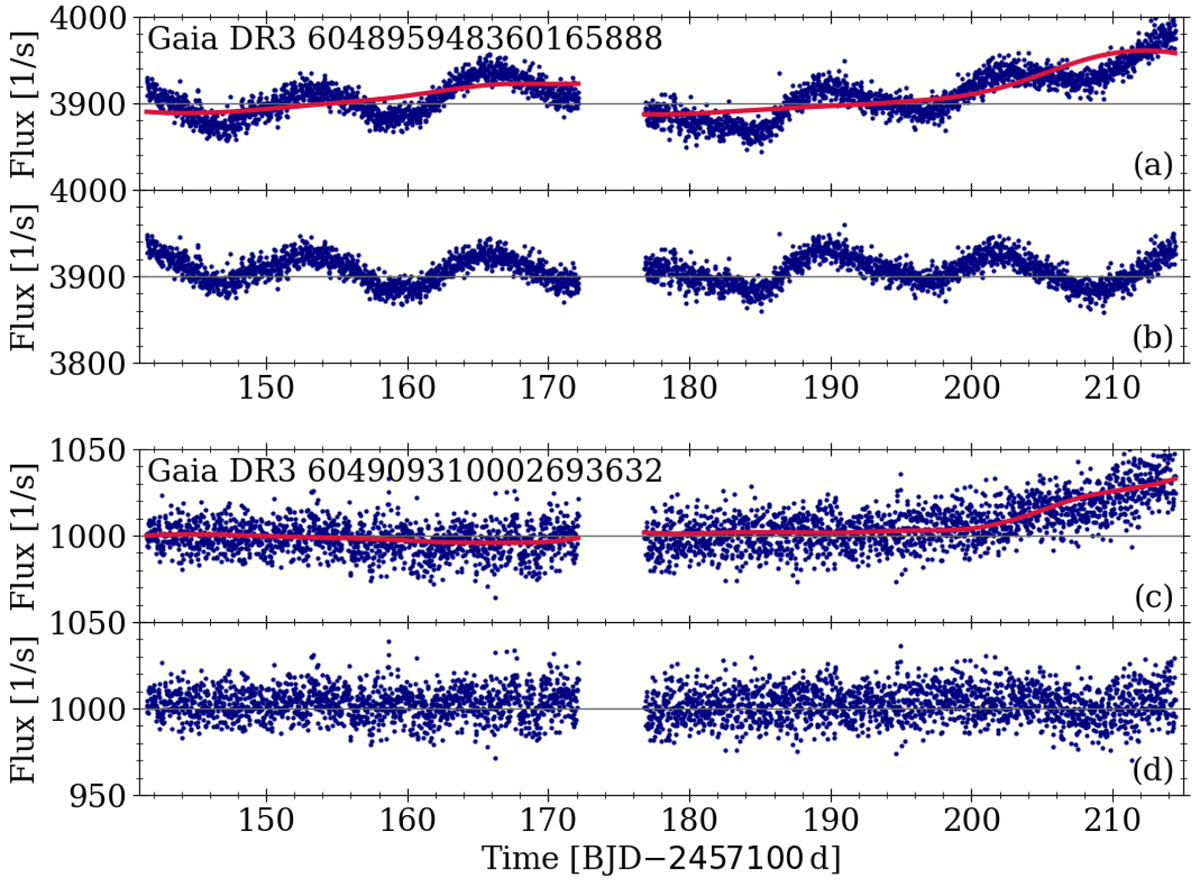
Fig. B.12.
Download original image
Application of the PCA correction to the example star Gaia DR3 604895948360165888 (panels a and b), and the fainter and essentially constant star Gaia DR3 604909310002693632 (panels c and d). Panels (a) and (c) each show the result of the instrumental systematics correction (blue) and the PCA correction (red) whereas panels (b) and (d) show the final light curve after the PCA correction was applied.
Current usage metrics show cumulative count of Article Views (full-text article views including HTML views, PDF and ePub downloads, according to the available data) and Abstracts Views on Vision4Press platform.
Data correspond to usage on the plateform after 2015. The current usage metrics is available 48-96 hours after online publication and is updated daily on week days.
Initial download of the metrics may take a while.