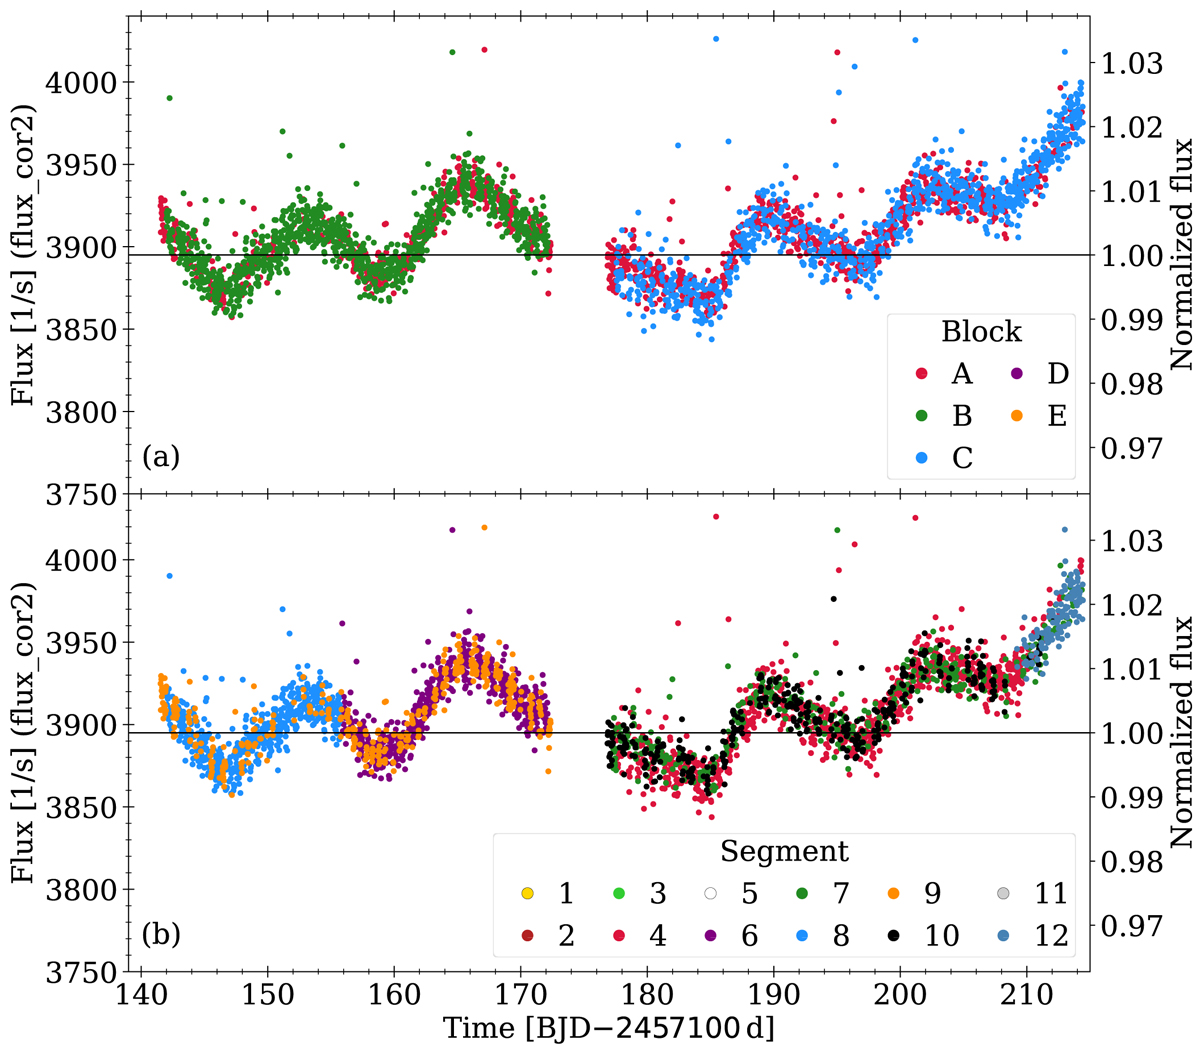
Fig. B.10.
Download original image
Light curve of Gaia DR3 604895948360165888 after the application of the second correction, the realignment of the segments. Both panels show the same light curve. The color coding in the upper panel indicates the block. In the lower panel, the colors indicate the segments as in Fig. B.4. We emphasize that the flux axis is identical between the Figs. B.6, B.9, and this one.
Current usage metrics show cumulative count of Article Views (full-text article views including HTML views, PDF and ePub downloads, according to the available data) and Abstracts Views on Vision4Press platform.
Data correspond to usage on the plateform after 2015. The current usage metrics is available 48-96 hours after online publication and is updated daily on week days.
Initial download of the metrics may take a while.