Fig. B.8.
Download original image
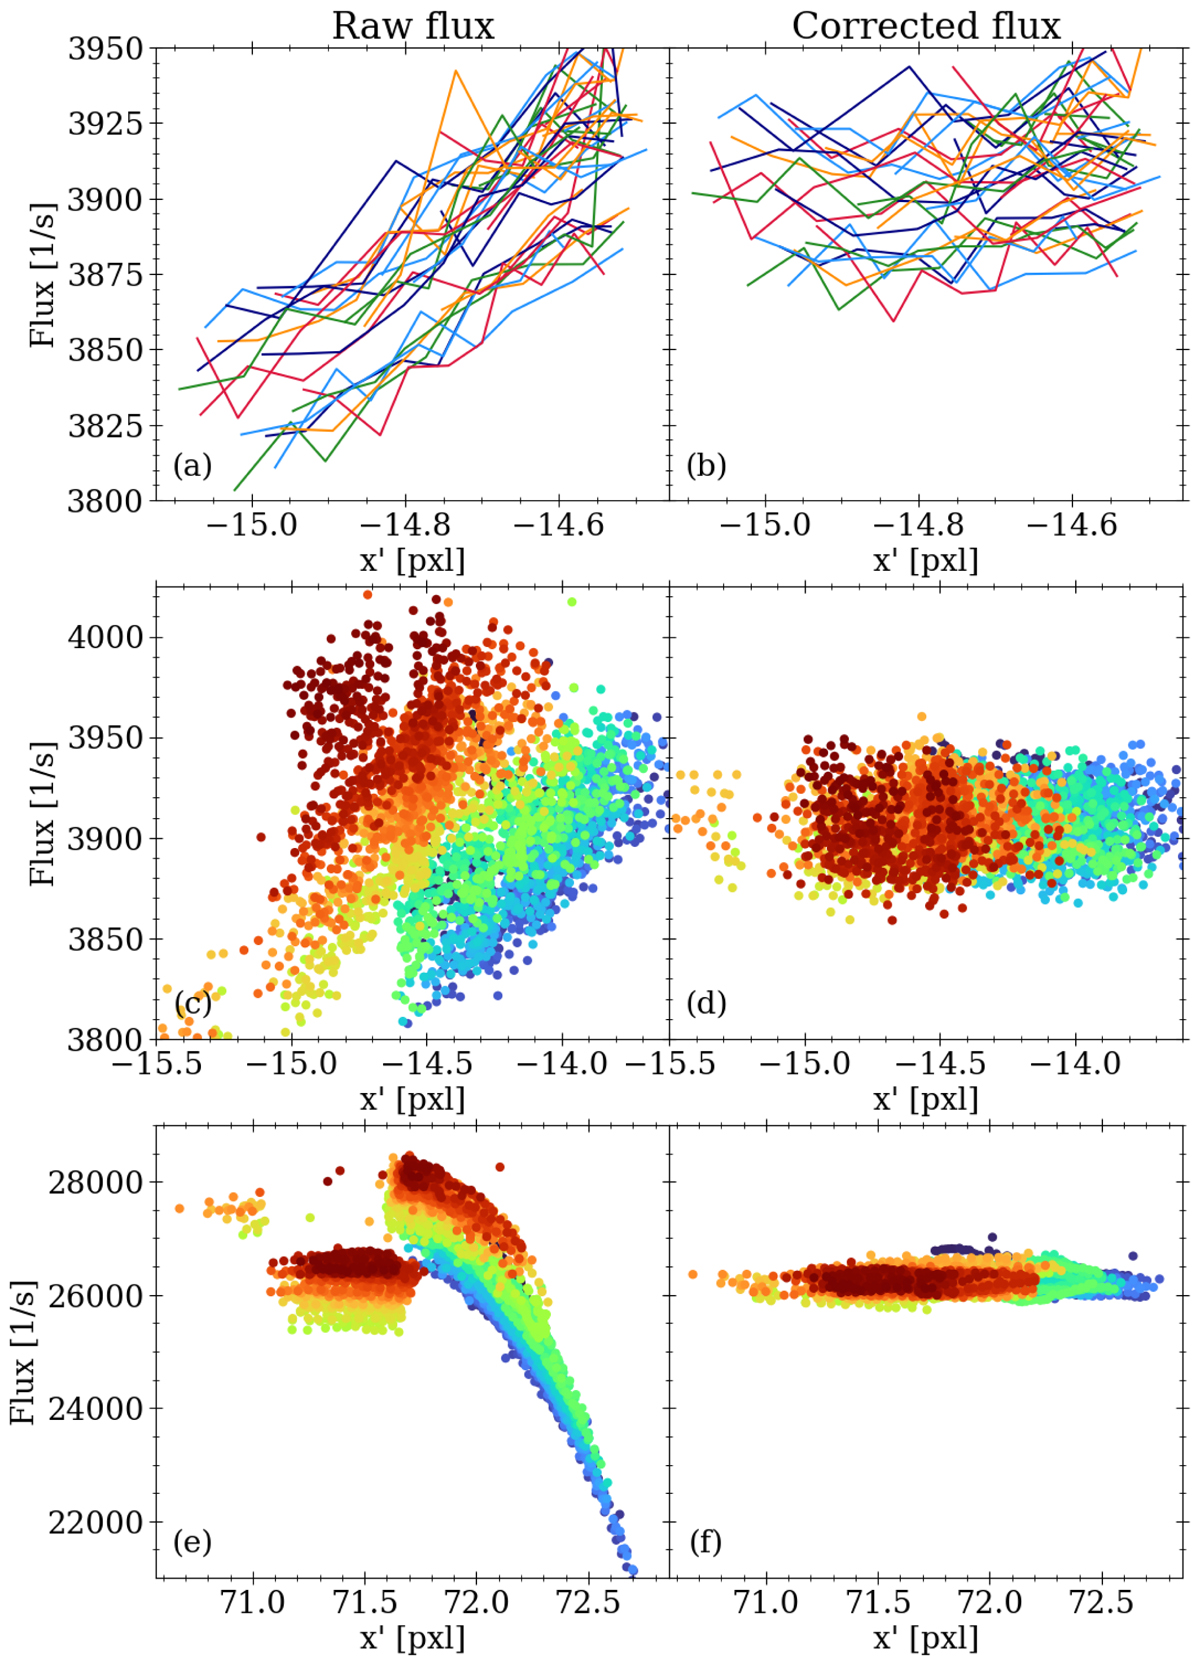
Position dependence of the recorded raw flux fraw(x′) and the correction thereof. Panel (a) shows the raw flux from Gaia DR3 604895948360165888 as a function of the detector coordinate and clearly shows the linear dependence. Flux values are plotted for the same slices as in Fig. B.7. Each line represents one slice. Panel (b) shows the same slices but with the flux after the correction is applied. Panels (c) + (d) are similar to (a) + (b), only for the full light curve of Gaia DR3 604895948360165888 and the color coding representing the time as in Fig. B.2. Panels (e) + (f) are the same as (c) + (d) but for Gaia DR3 604917629355039360 for which the position dependency becomes nonlinear.
Current usage metrics show cumulative count of Article Views (full-text article views including HTML views, PDF and ePub downloads, according to the available data) and Abstracts Views on Vision4Press platform.
Data correspond to usage on the plateform after 2015. The current usage metrics is available 48-96 hours after online publication and is updated daily on week days.
Initial download of the metrics may take a while.