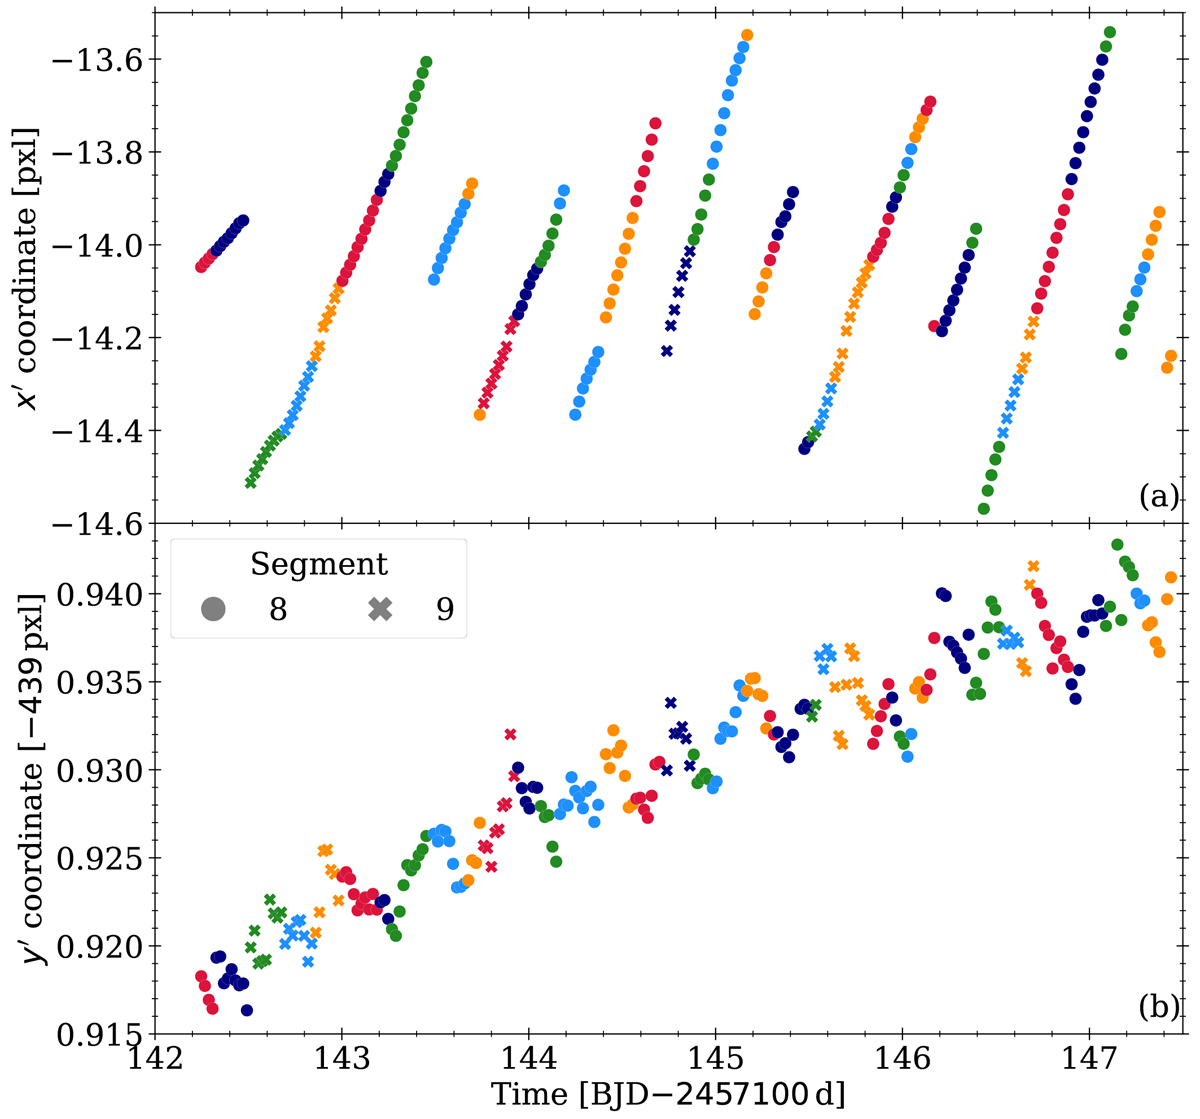
Fig. B.7.
Download original image
Designation of the slices in a short light curve segment. Panels (a) and (b) show the time dependency of x′(t) and y′(t), respectively. The alternating color coding distinguishes individual slices and different symbols refer to different segments as indicated in panel (b). Only a small cutout from the full light curve is shown, corresponding to the shaded area in Fig. B.4. It contains 40 slices for the sample star Gaia DR3 604895948360165888.
Current usage metrics show cumulative count of Article Views (full-text article views including HTML views, PDF and ePub downloads, according to the available data) and Abstracts Views on Vision4Press platform.
Data correspond to usage on the plateform after 2015. The current usage metrics is available 48-96 hours after online publication and is updated daily on week days.
Initial download of the metrics may take a while.