Fig. B.5.
Download original image
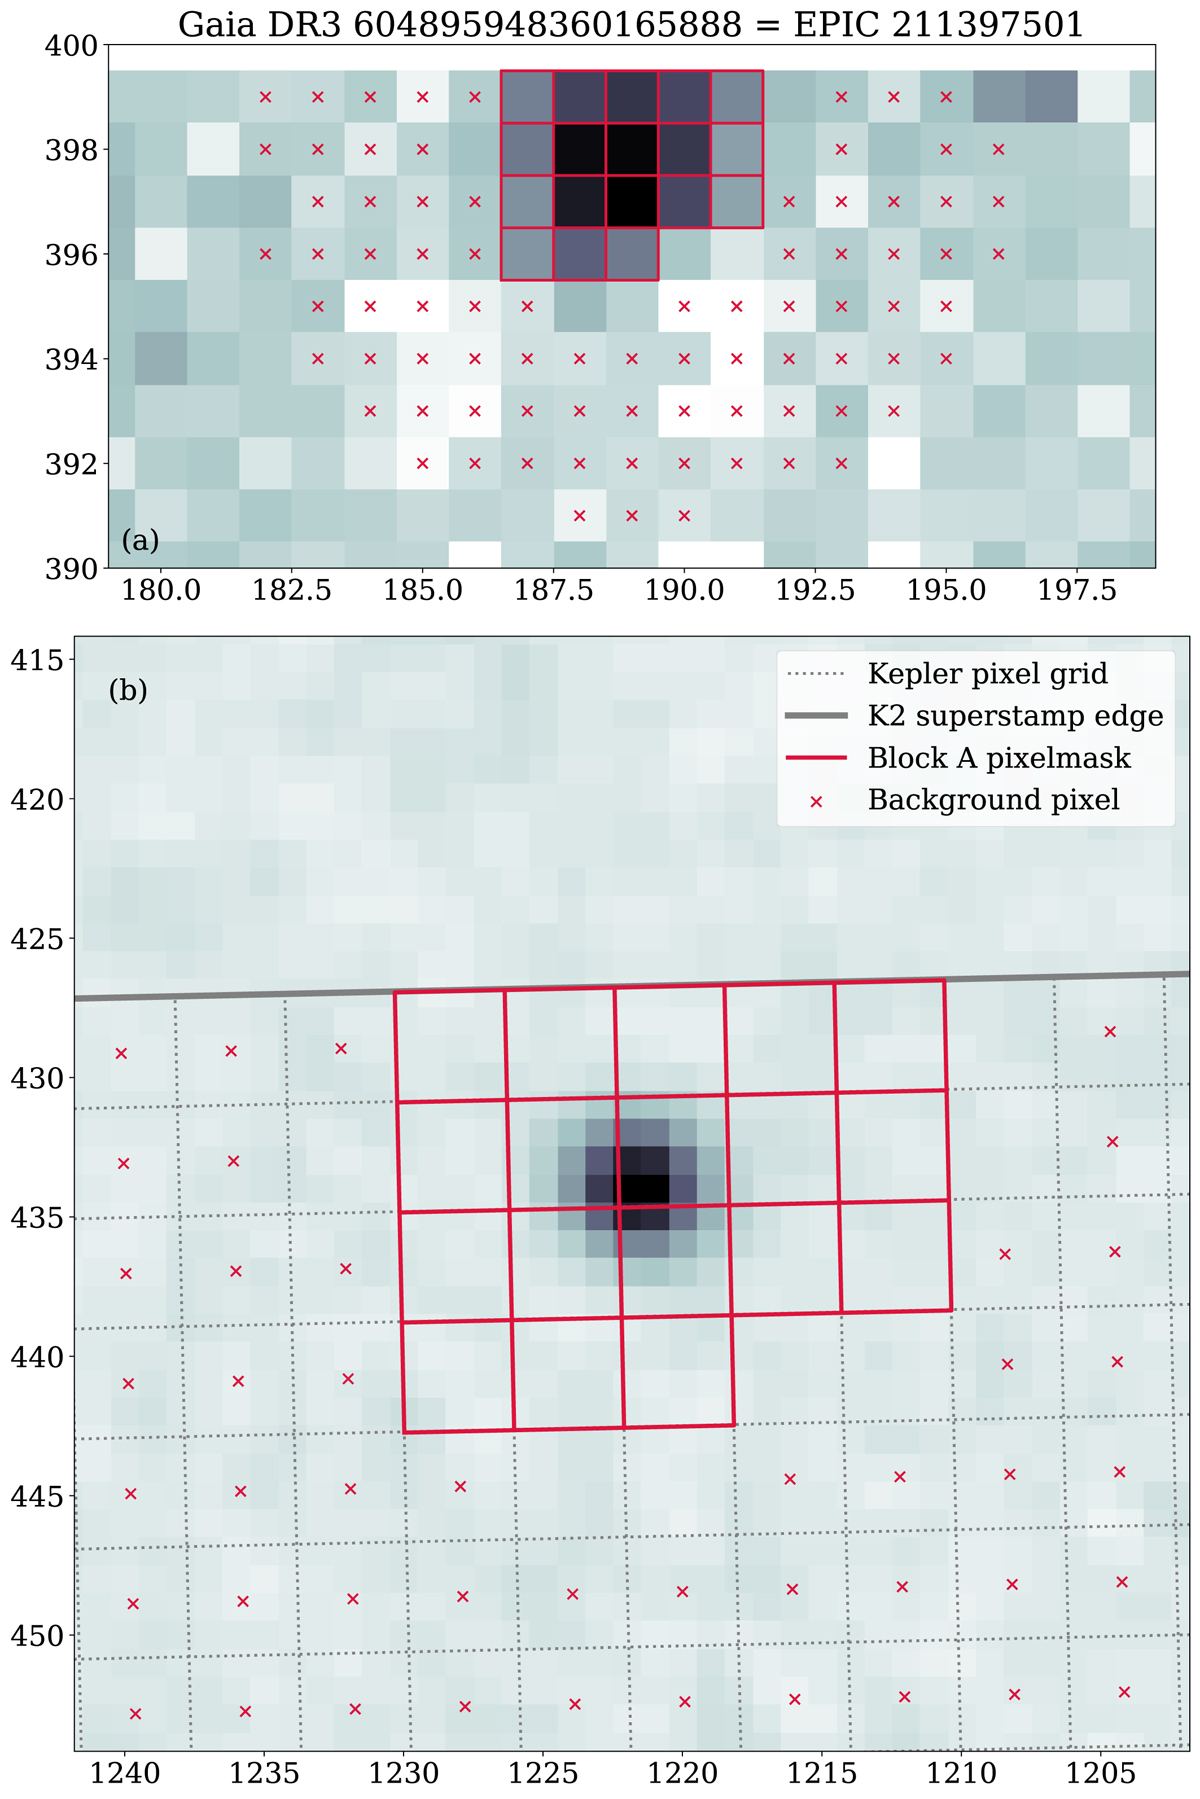
Pixelmask and background selection for Gaia DR3 604895948360165888 in block A. Panel (a) shows an averaged K2 superstamp image around the target. Panel (b) shows a comparison with a DSS2 (red channel) image of the same region. K2 pixels outlined in red mark the chosen pixelmasks pixels selected for the background estimate are marked with an X. The DSS2 image has the K2 pixelgrid indicated by the dotted lines and the solid line marks the edge of the superstamp.
Current usage metrics show cumulative count of Article Views (full-text article views including HTML views, PDF and ePub downloads, according to the available data) and Abstracts Views on Vision4Press platform.
Data correspond to usage on the plateform after 2015. The current usage metrics is available 48-96 hours after online publication and is updated daily on week days.
Initial download of the metrics may take a while.