Open Access
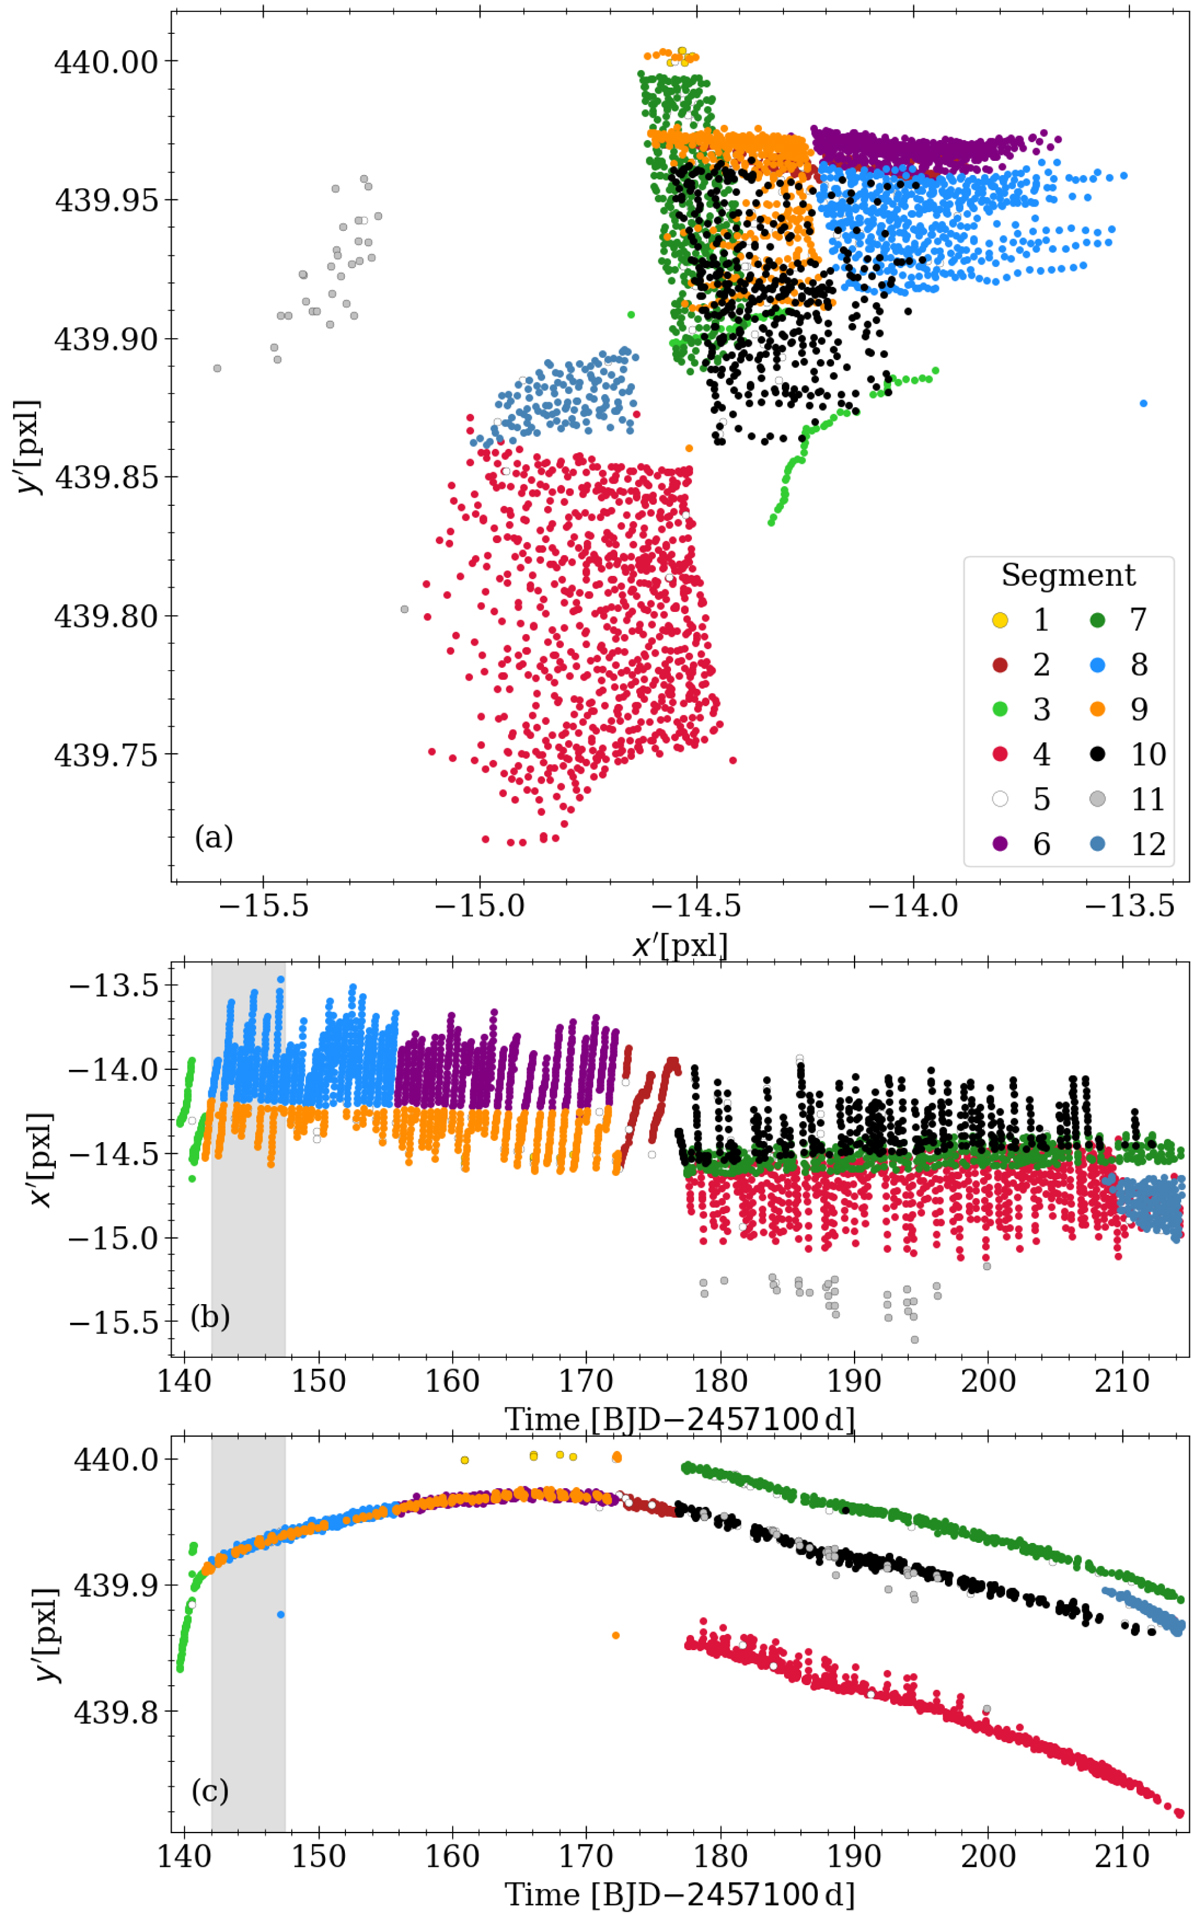
Fig. B.4.
Download original image
Motion of the sample star Gaia DR3 604895948360165888 across the detector during C05. The correspondence of each point with the segments is color coded. The gray shaded area is inspected more closely in Fig. B.7 below.
Current usage metrics show cumulative count of Article Views (full-text article views including HTML views, PDF and ePub downloads, according to the available data) and Abstracts Views on Vision4Press platform.
Data correspond to usage on the plateform after 2015. The current usage metrics is available 48-96 hours after online publication and is updated daily on week days.
Initial download of the metrics may take a while.