Fig. B.2.
Download original image
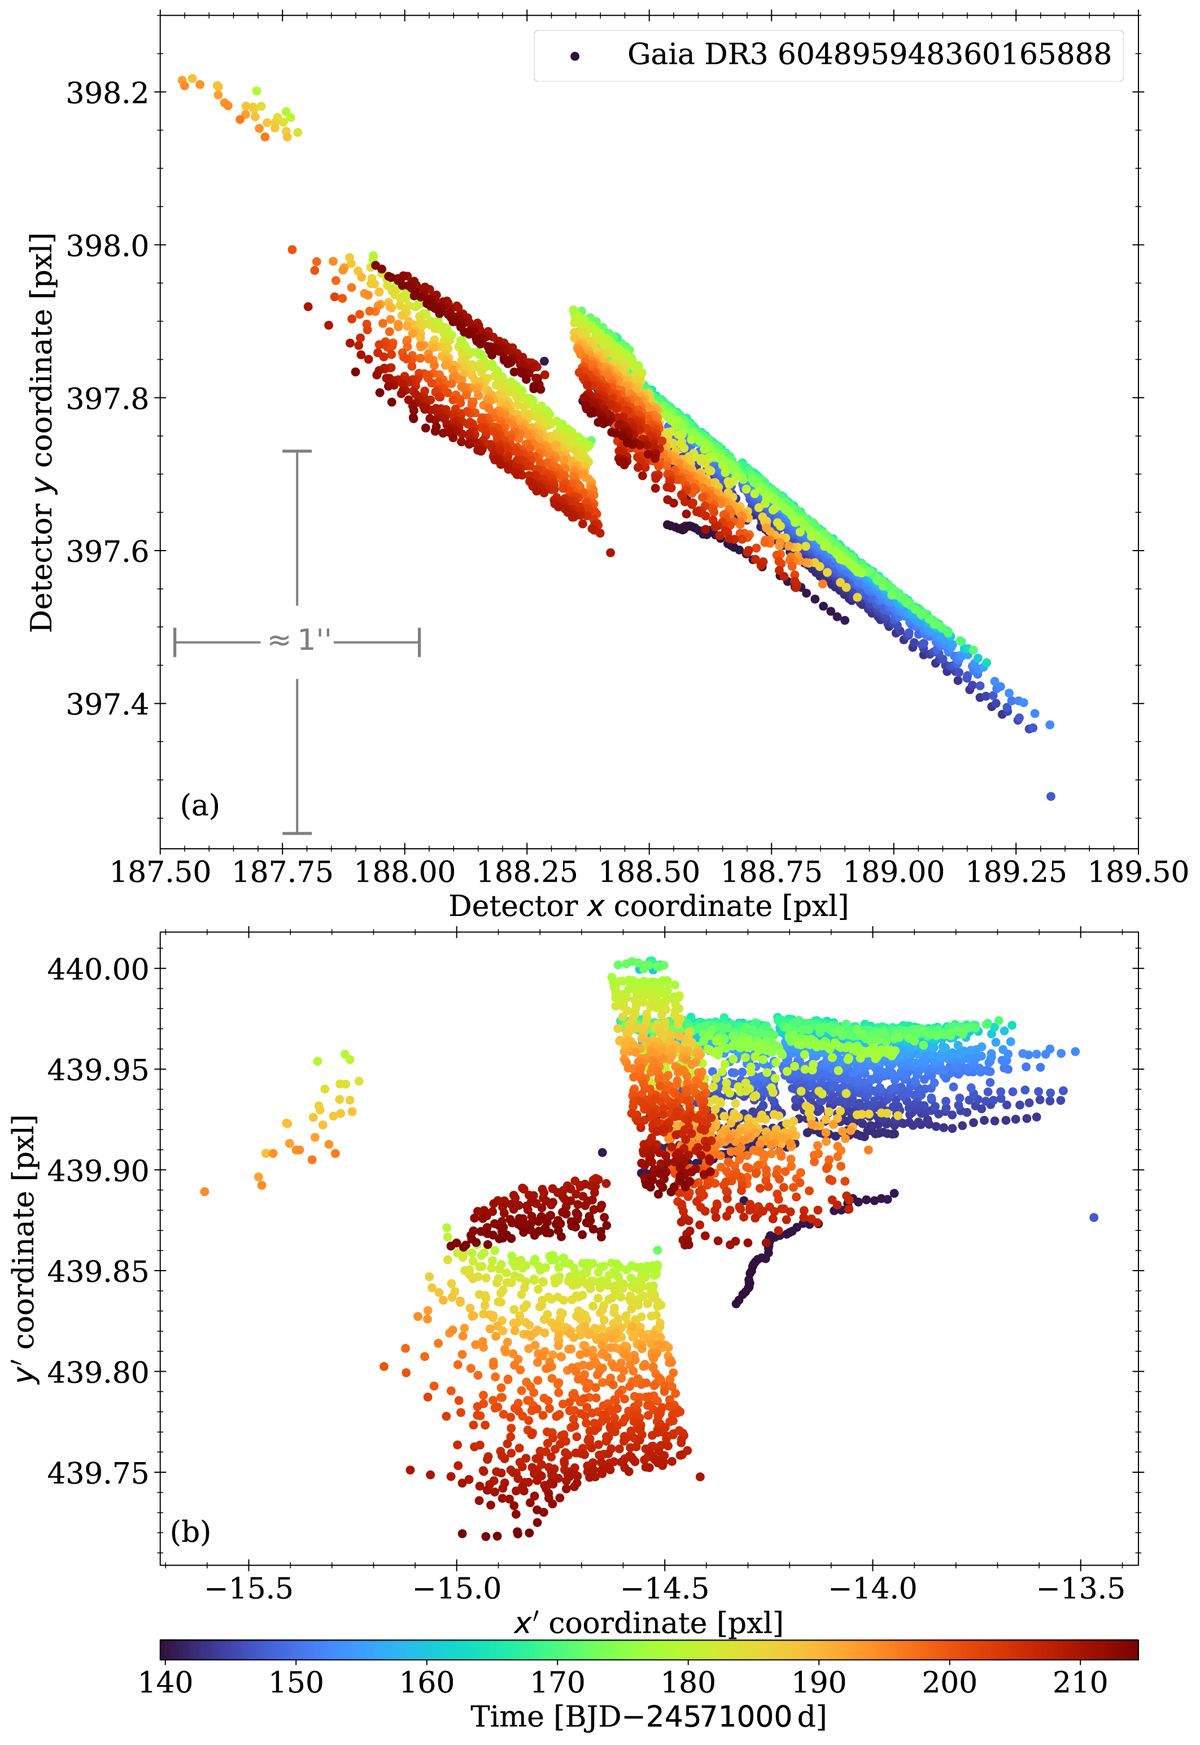
Motion of the sample star Gaia DR3 604895948360165888 across the detector during C05. Each point represents the central position in one image color coded with the time of observation. Panel (a) gives the original detector coordinates and panel (b) those after the rotation applied. The extent of 1″ on-sky is indicated. We note the difference in scaling between the x and y coordinate axes, and the change from (a) to (b).
Current usage metrics show cumulative count of Article Views (full-text article views including HTML views, PDF and ePub downloads, according to the available data) and Abstracts Views on Vision4Press platform.
Data correspond to usage on the plateform after 2015. The current usage metrics is available 48-96 hours after online publication and is updated daily on week days.
Initial download of the metrics may take a while.