Fig. B.1.
Download original image
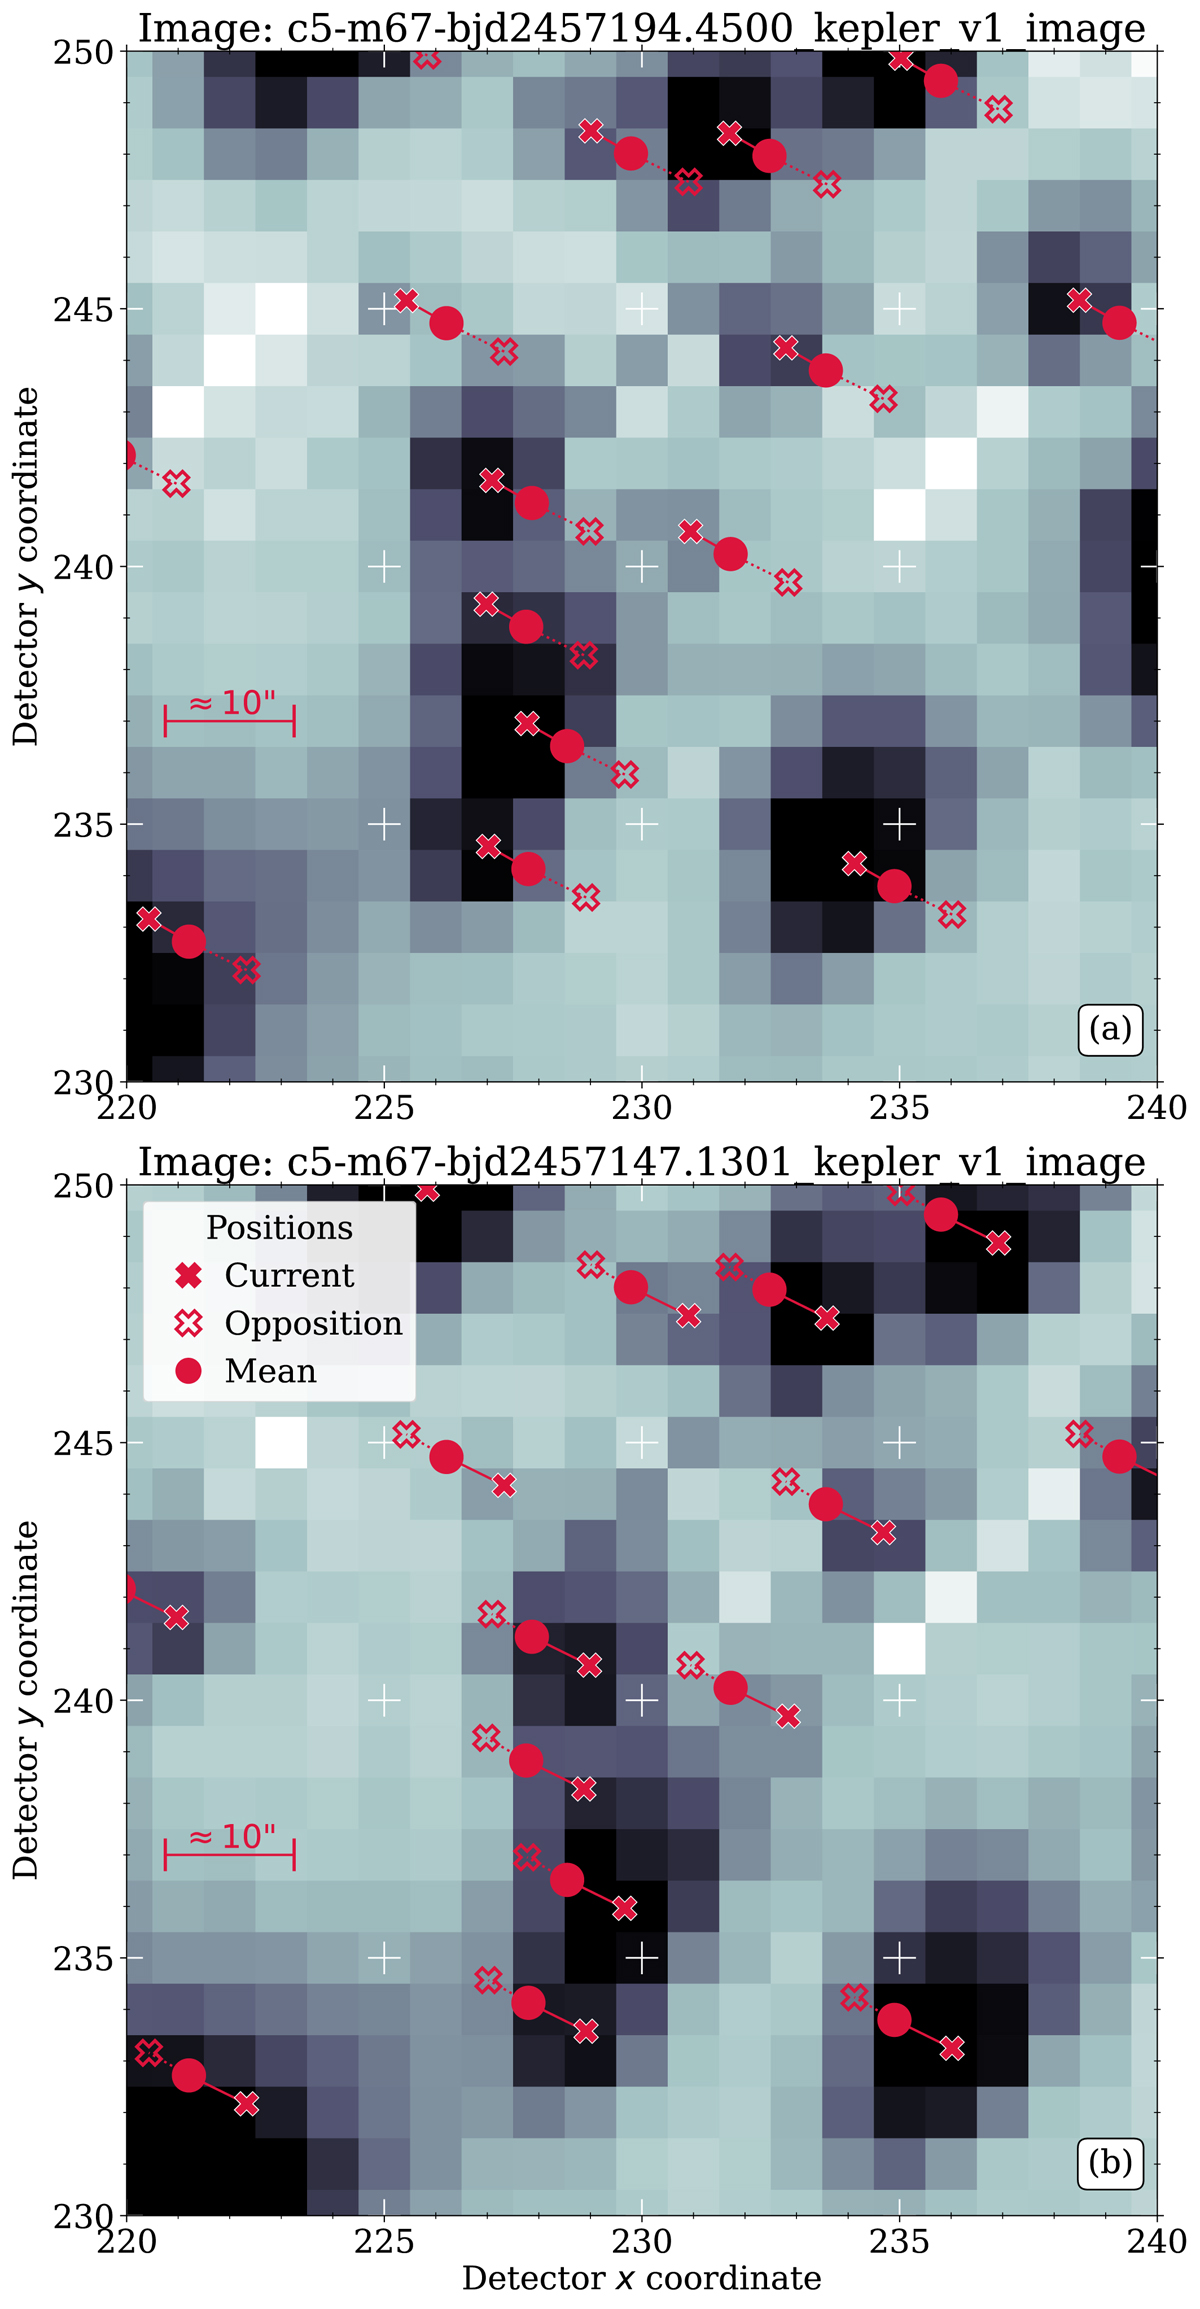
Visualization of the two most extreme positions of the telescope drift during C05. Upper and lower panel both show superstamp images (Δt ≈ 47 d) indicating the peak-to-peak positional variation, that is, the minimal and maximal x coordinate of a star. The CCD pixel range is identical in both images. The red dots represent the mean position of a star throughout the observing run, and the filled red crosses connected to them mark the position at the time of the image. Red outlines crosses indicate the extreme opposite positions of a star. The white crosses indicate identical pixel coordinates in both panels to help to visualize the magnitude of the positional changes.
Current usage metrics show cumulative count of Article Views (full-text article views including HTML views, PDF and ePub downloads, according to the available data) and Abstracts Views on Vision4Press platform.
Data correspond to usage on the plateform after 2015. The current usage metrics is available 48-96 hours after online publication and is updated daily on week days.
Initial download of the metrics may take a while.