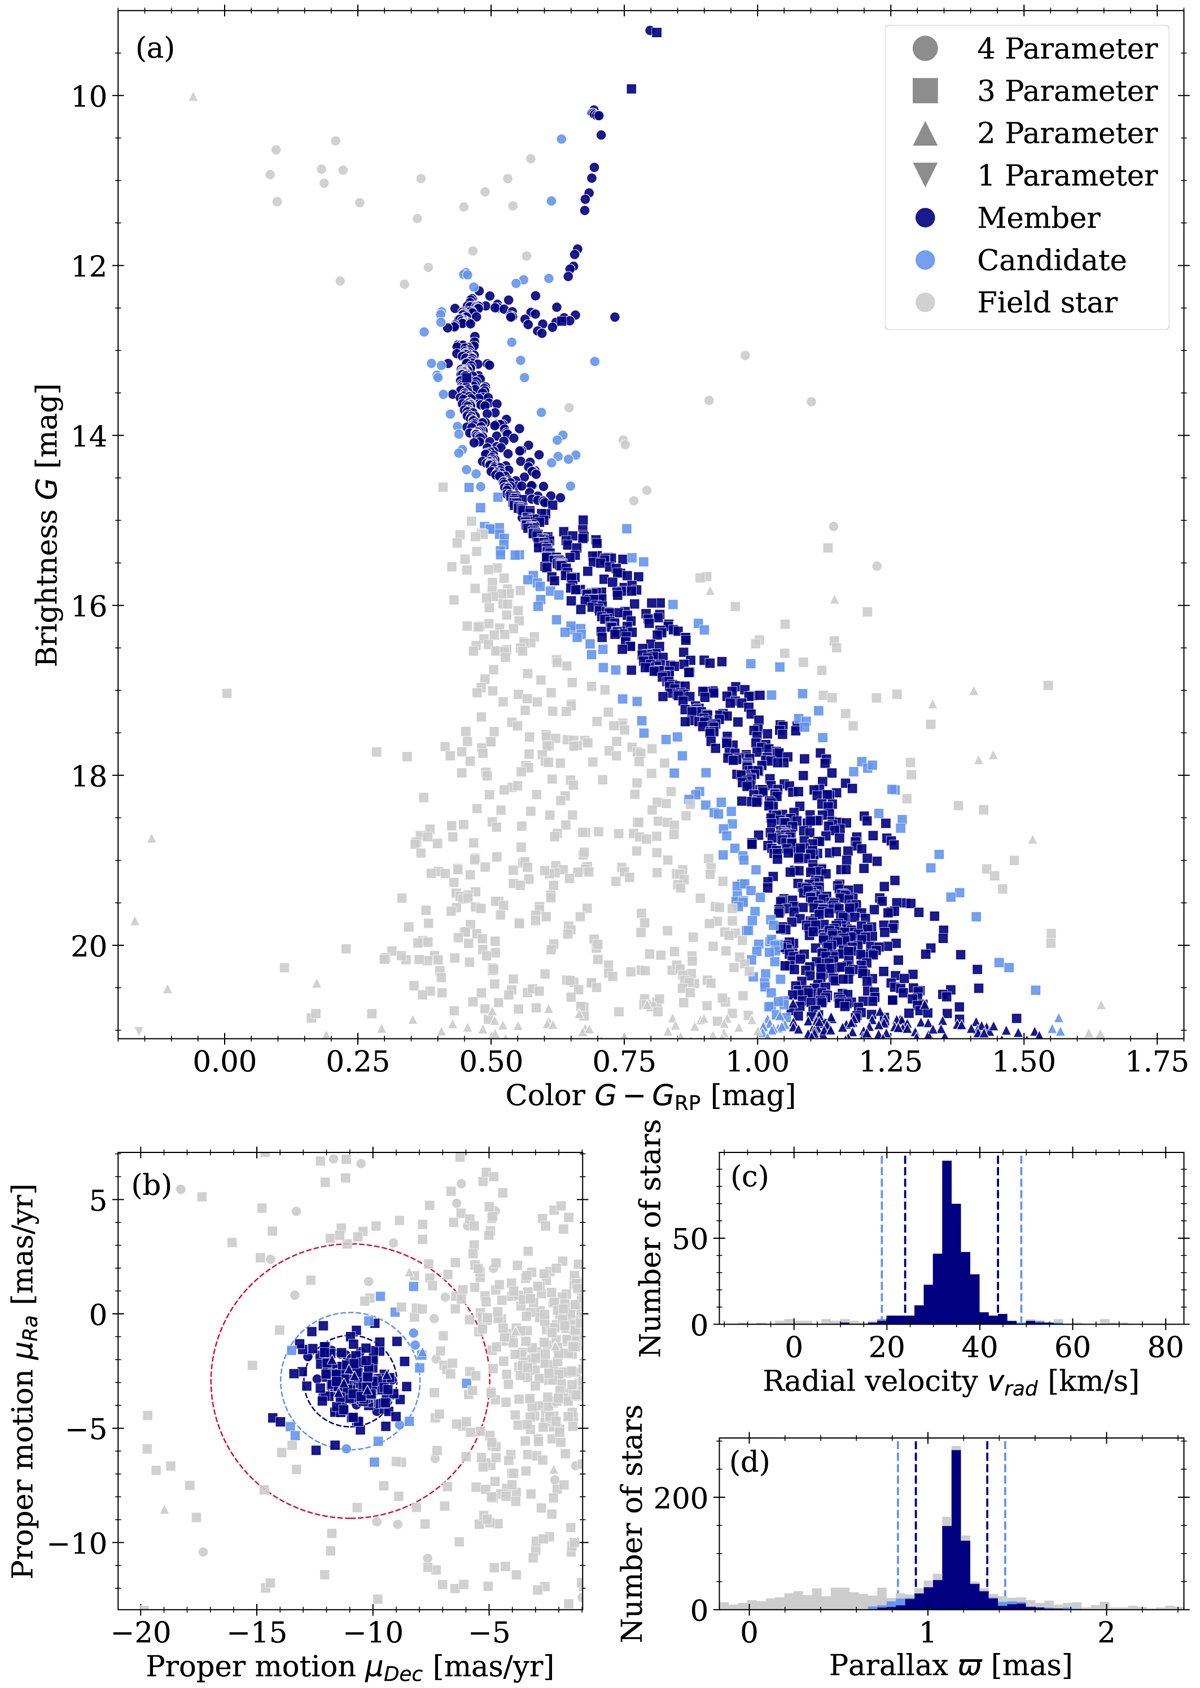
Fig. A.1.
Download original image
M 67 cluster membership evaluation. The panels (a) to (d) show the individual parameters used for our membership analysis: photometry, proper motions, radial velocity and parallax, respectively. Each point in panels (a) and (b) is a Gaia DR3 target in the field of view. Panels (c) and (d) show histograms (gray) of the sample. The parameter numbering in the legend refers to the number of parameters that are available per star. The color coding indicates the assigned membership status. We note that this refers solely to the membership on the respective parameter of panel, not on the total membership. For an overview of the total membership, see Fig. 2. The dashed lines in panels (b), (c), and (d) indicate the parameter ranges for member and candidate designations based on Eqs. (A.1) to (A.6) (dark and light blue, respectively). The red circle in panel (b) indicates the 8 mas/yr cutoff.
Current usage metrics show cumulative count of Article Views (full-text article views including HTML views, PDF and ePub downloads, according to the available data) and Abstracts Views on Vision4Press platform.
Data correspond to usage on the plateform after 2015. The current usage metrics is available 48-96 hours after online publication and is updated daily on week days.
Initial download of the metrics may take a while.