Fig. 17.
Download original image
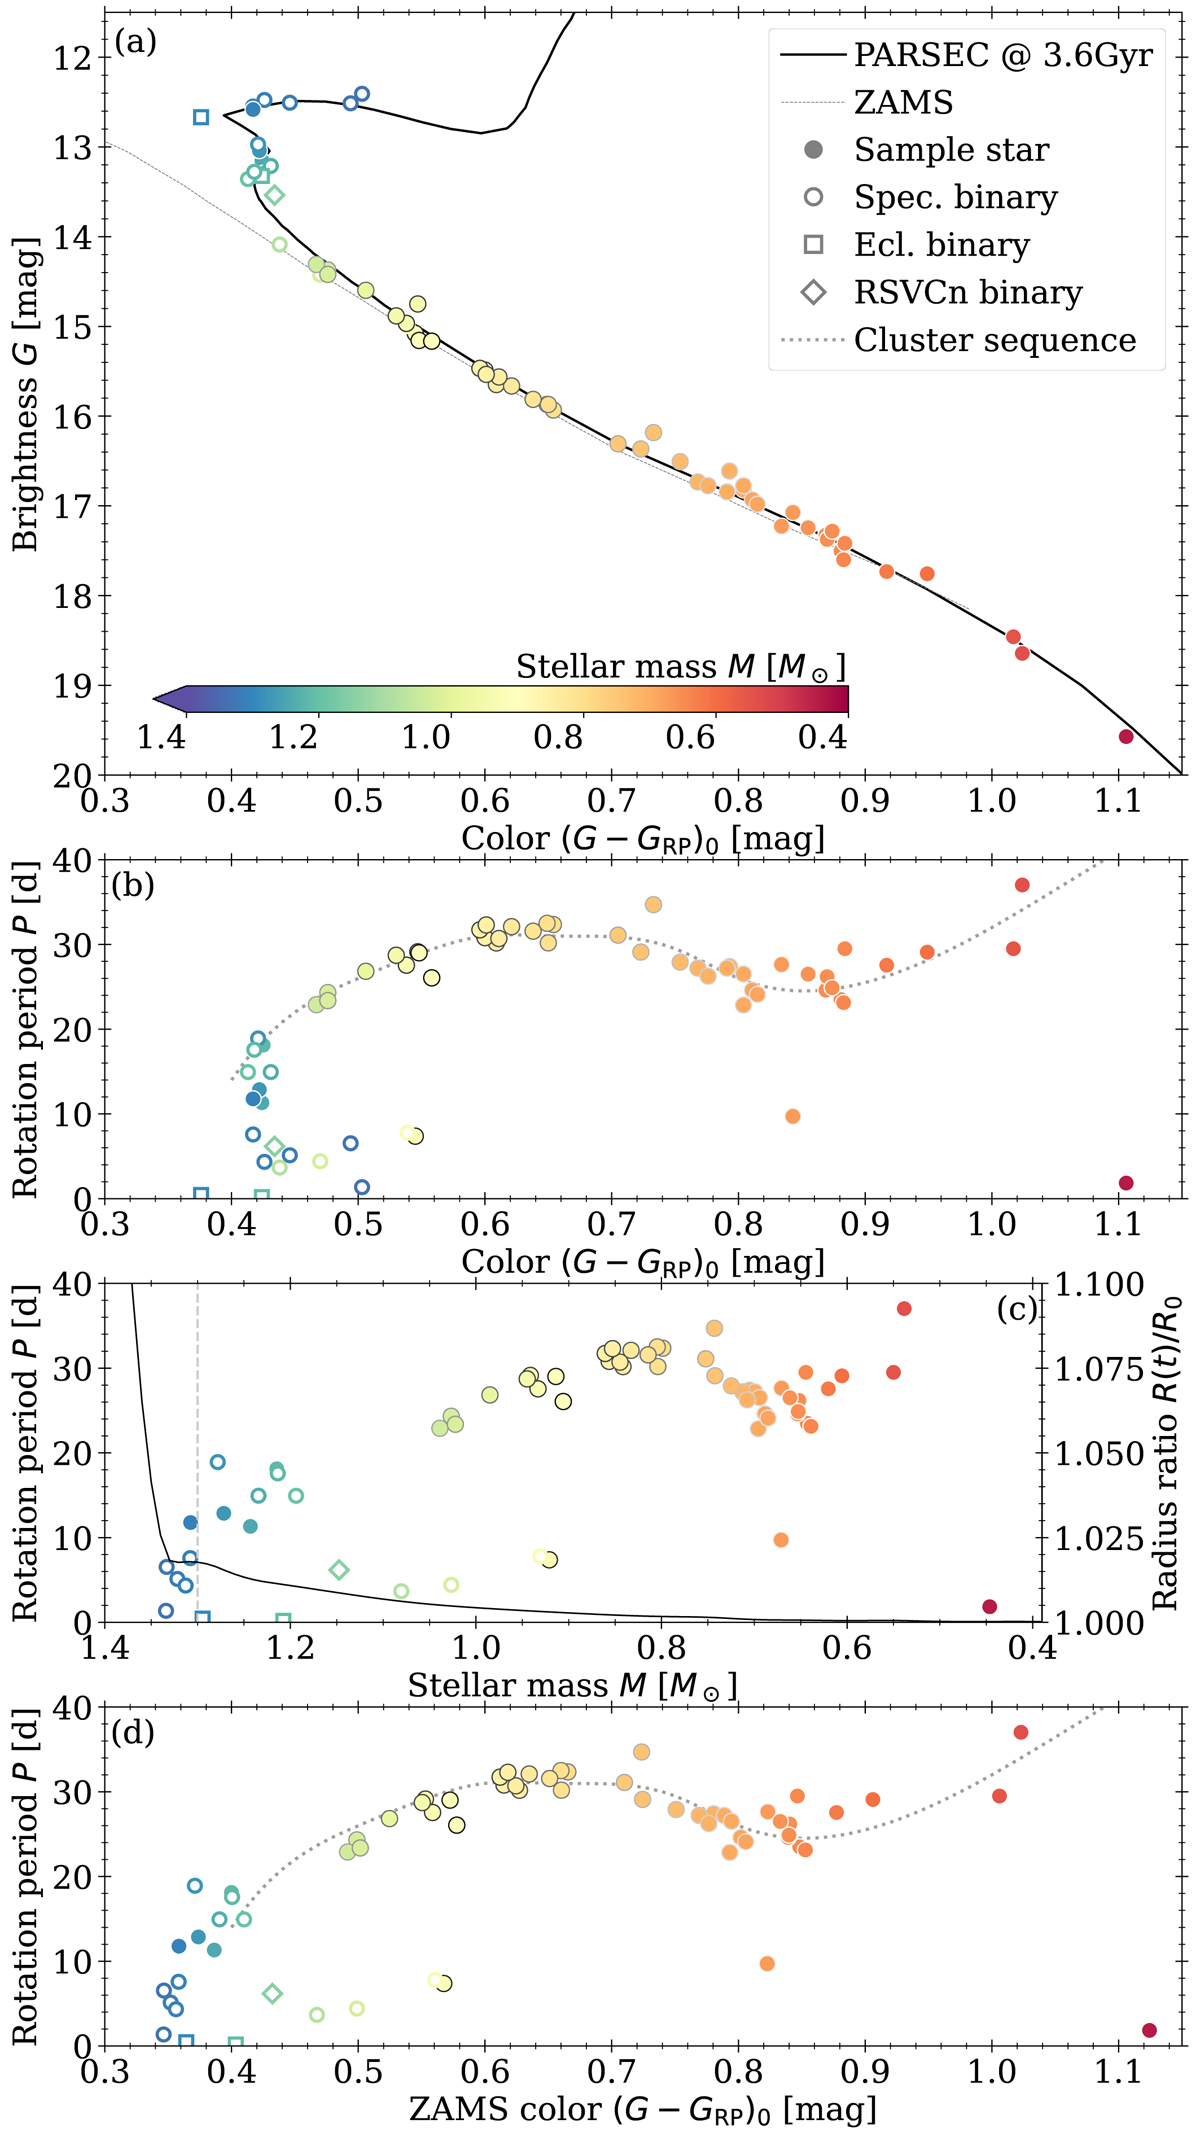
CMD and three CPDs highlighting M 67 sample stars evolved beyond the Main sequence. Panel a shows a CMD of our sample with the stars color coded according to their masses. Differing symbols distinguish different types of binaries. Panel b shows a corresponding CPD in Gaia colors and identical symbols. Panel c plots the rotation periods of the stars against their estimated masses. An approximate indication of the position where stars cease to have an outer convective zones (i.e., the Kraft break) is overplotted with a dashed gray line. The solid black line corresponds to the scaling on the right and denotes the ratio between current (R(t)) and ZAMS stellar radius (R0). Panel d shows an inferred CPD with stars assigned colors they had when on the ZAMS.
Current usage metrics show cumulative count of Article Views (full-text article views including HTML views, PDF and ePub downloads, according to the available data) and Abstracts Views on Vision4Press platform.
Data correspond to usage on the plateform after 2015. The current usage metrics is available 48-96 hours after online publication and is updated daily on week days.
Initial download of the metrics may take a while.