Fig. 10.
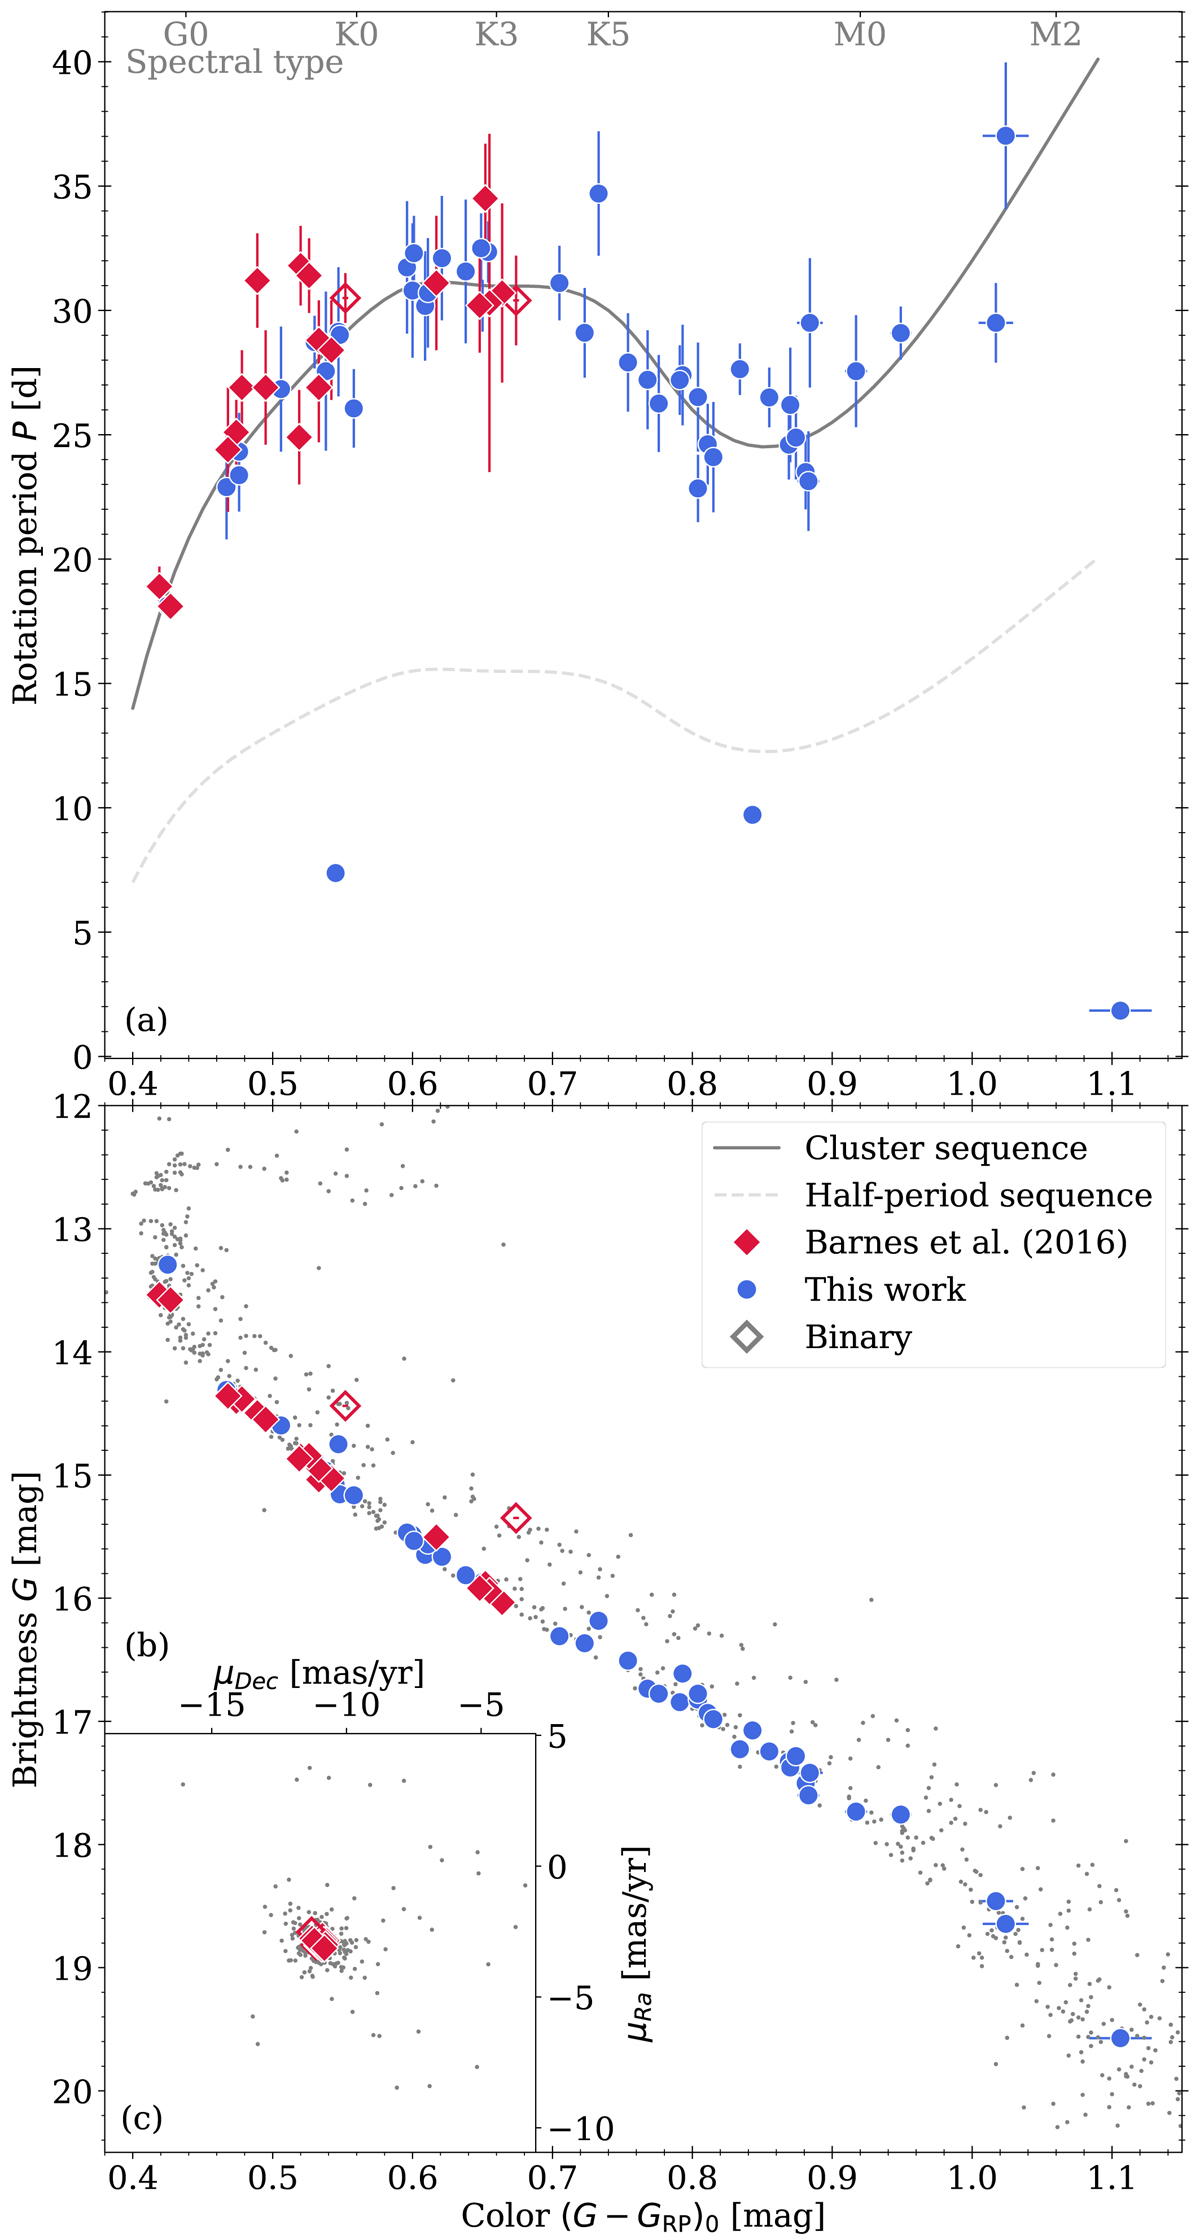
Download original image
Comparison of our results with those of Barnes et al. (2016). Panel a shows a CPD as in Fig. 9 and overplotted in red are the measurements by Barnes et al. (2016). The gray lines, solid and dashed, are our indication of the cluster and half-period sequences, respectively. Panel b shows a CMD of the same stars and the inset (panel c) the proper motions centered on M 67. Gray dots in panels b and c are members without period determinations.
Current usage metrics show cumulative count of Article Views (full-text article views including HTML views, PDF and ePub downloads, according to the available data) and Abstracts Views on Vision4Press platform.
Data correspond to usage on the plateform after 2015. The current usage metrics is available 48-96 hours after online publication and is updated daily on week days.
Initial download of the metrics may take a while.