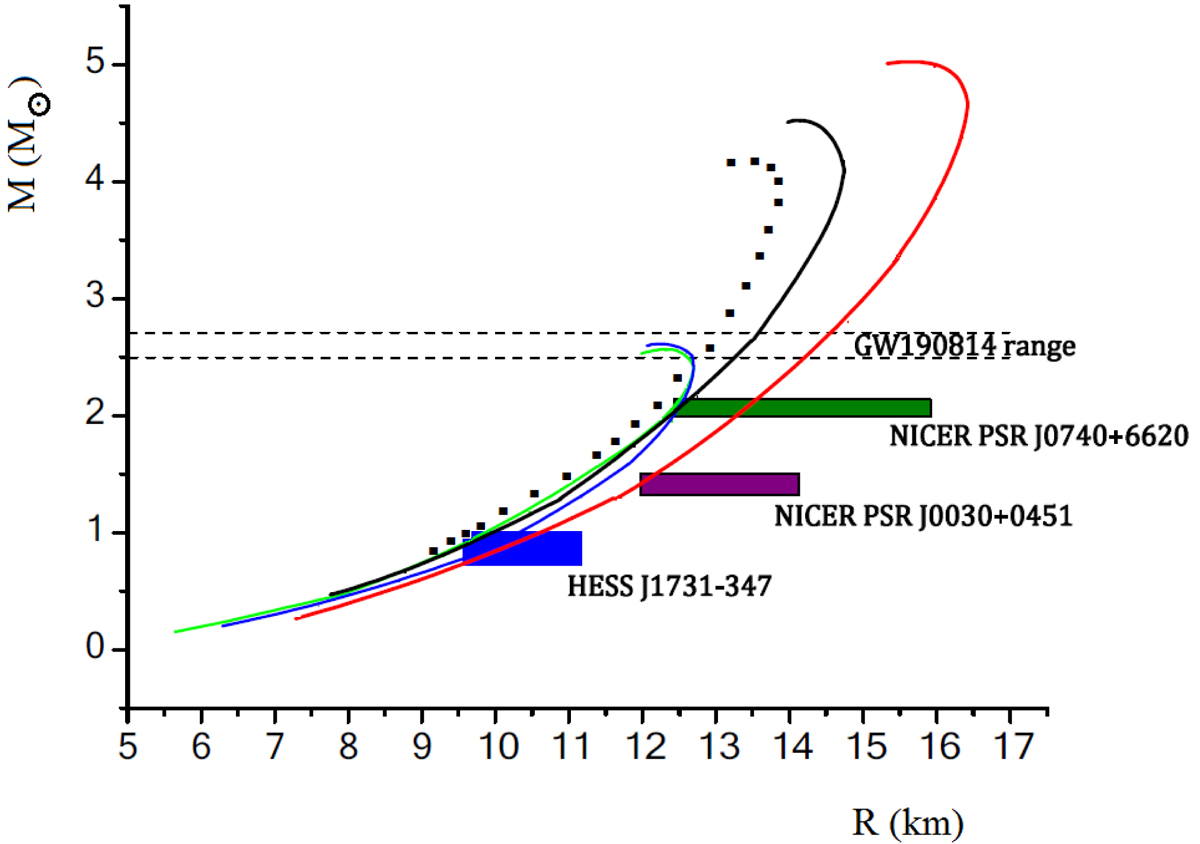
Fig. 1.
Download original image
Mass–radius relation of the theoretical models vs. observed data. The green curve corresponds to the MFTQCD quark EoS, with ξ = 0.003658 MeV−1 and BQCD = 62 MeV fm−3. The blue curve depicts the results for the NJL CFL+vector interactions EoS with B0 = 57.3 MeV fm−3 and GV/GS = 0.5. Two anisotropic models corresponding to the Thirukkanesh–Ragel–Malaver ansatz, both with Δ = 100 MeV and ms = 150 MeV appear in red (corresponding to B = 57.5 MeV fm−3) and black (B = 70 MeV fm−3). The dotted sequence is the Δ → 0 for the same anisotropic models with B = 70 MeV fm−3, showing that the downward shift in the stellar sequence curves is not dramatic and may be viable as a model of the new object. Data rectangles are 1σ estimates for PSR J0030+0451 (purple), PSR 0740+6620 (green) and the recently reported HESS J1731−347 (blue).
Current usage metrics show cumulative count of Article Views (full-text article views including HTML views, PDF and ePub downloads, according to the available data) and Abstracts Views on Vision4Press platform.
Data correspond to usage on the plateform after 2015. The current usage metrics is available 48-96 hours after online publication and is updated daily on week days.
Initial download of the metrics may take a while.