Fig. 6
Download original image
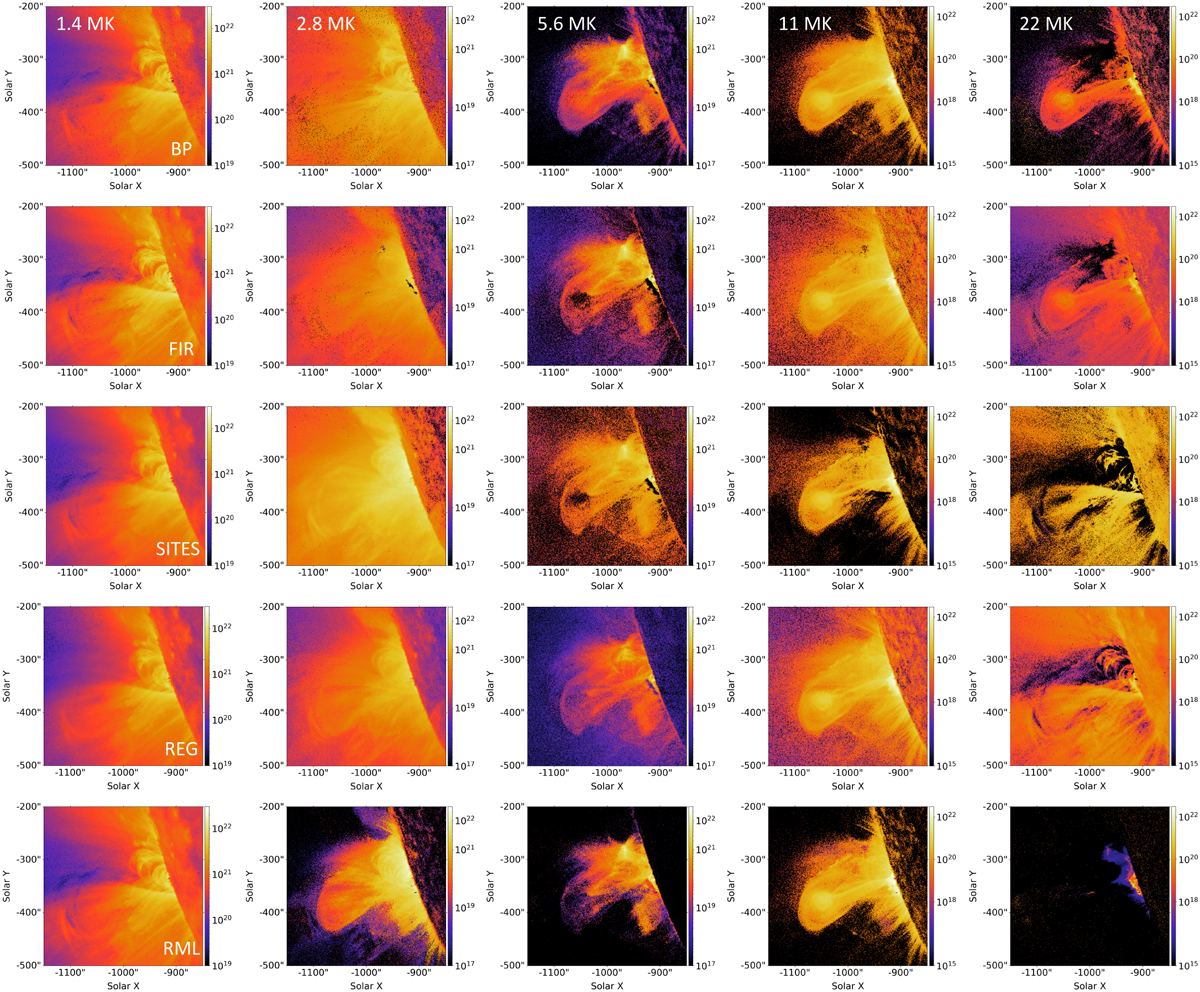
DEM maps reconstructed from the AIA images shown in Fig. 4. Rows, from top to bottom: the BP method (Cheung et al. 2015), the FIR method (Plowman et al. 2013), the SITES method (Morgan & Pickering 2019), the REG method (Hannah & Kontar 2012), and our proposed RML method. The images of each column correspond to the same temperature, which is reported in the top left corner of the first row panels. The same color map is shared by each of the images in the same temperature column, with different (logarithmic) scalings for the different temperatures.
Current usage metrics show cumulative count of Article Views (full-text article views including HTML views, PDF and ePub downloads, according to the available data) and Abstracts Views on Vision4Press platform.
Data correspond to usage on the plateform after 2015. The current usage metrics is available 48-96 hours after online publication and is updated daily on week days.
Initial download of the metrics may take a while.