Fig. 5
Download original image
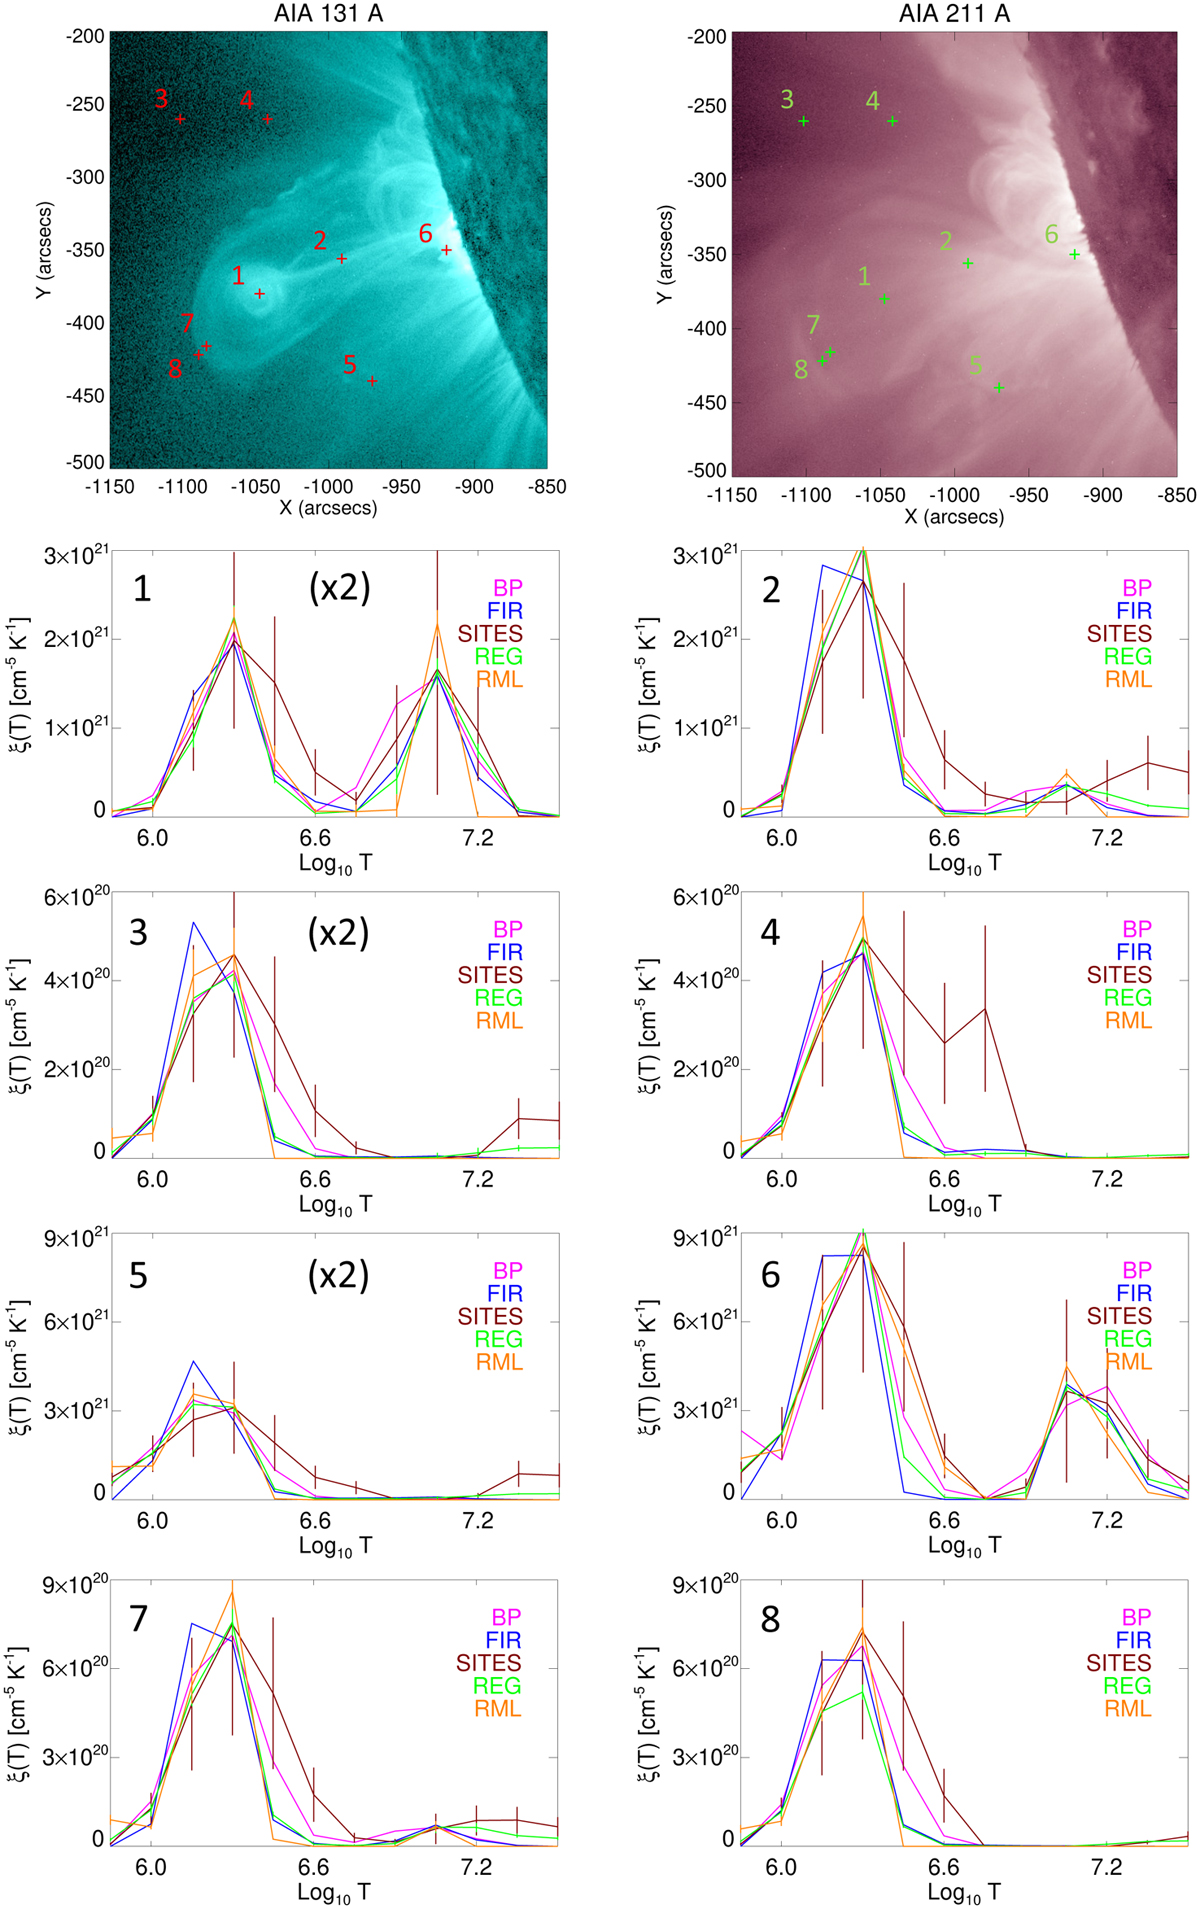
DEM profiles reconstructed from observed AIA count rates in selected pixels of the 2010 November 3 event. Top row: AIA images recorded around 12:15:02 UT in the 131 A and 211 A channels (left and right panel, respectively). The numbered crosses denote the location of the pixels selected for a comparison of the ξ(Τ) profiles reconstructed by the different methods. Second to fifth row: ξ(Τ) profiles associated with Pixels 1 through 8. In each panel, the profiles reconstructed by the BP, FIR, SITES, REG and RML methods are plotted in magenta, blue, brown, green, and orange, respectively. The ± 1σ uncertainties associated with the SITES, REG and RML reconstructions have been added as error bars at each temperature point in the pertinent reconstruction. The intensities of the reconstructions of Pixels 1, 3 and 5 have been multiplied by a factor of 2. The intensity axes are linear, while the temperature axes are in terms of log10 Τ (K).
Current usage metrics show cumulative count of Article Views (full-text article views including HTML views, PDF and ePub downloads, according to the available data) and Abstracts Views on Vision4Press platform.
Data correspond to usage on the plateform after 2015. The current usage metrics is available 48-96 hours after online publication and is updated daily on week days.
Initial download of the metrics may take a while.