Fig. 6
Download original image
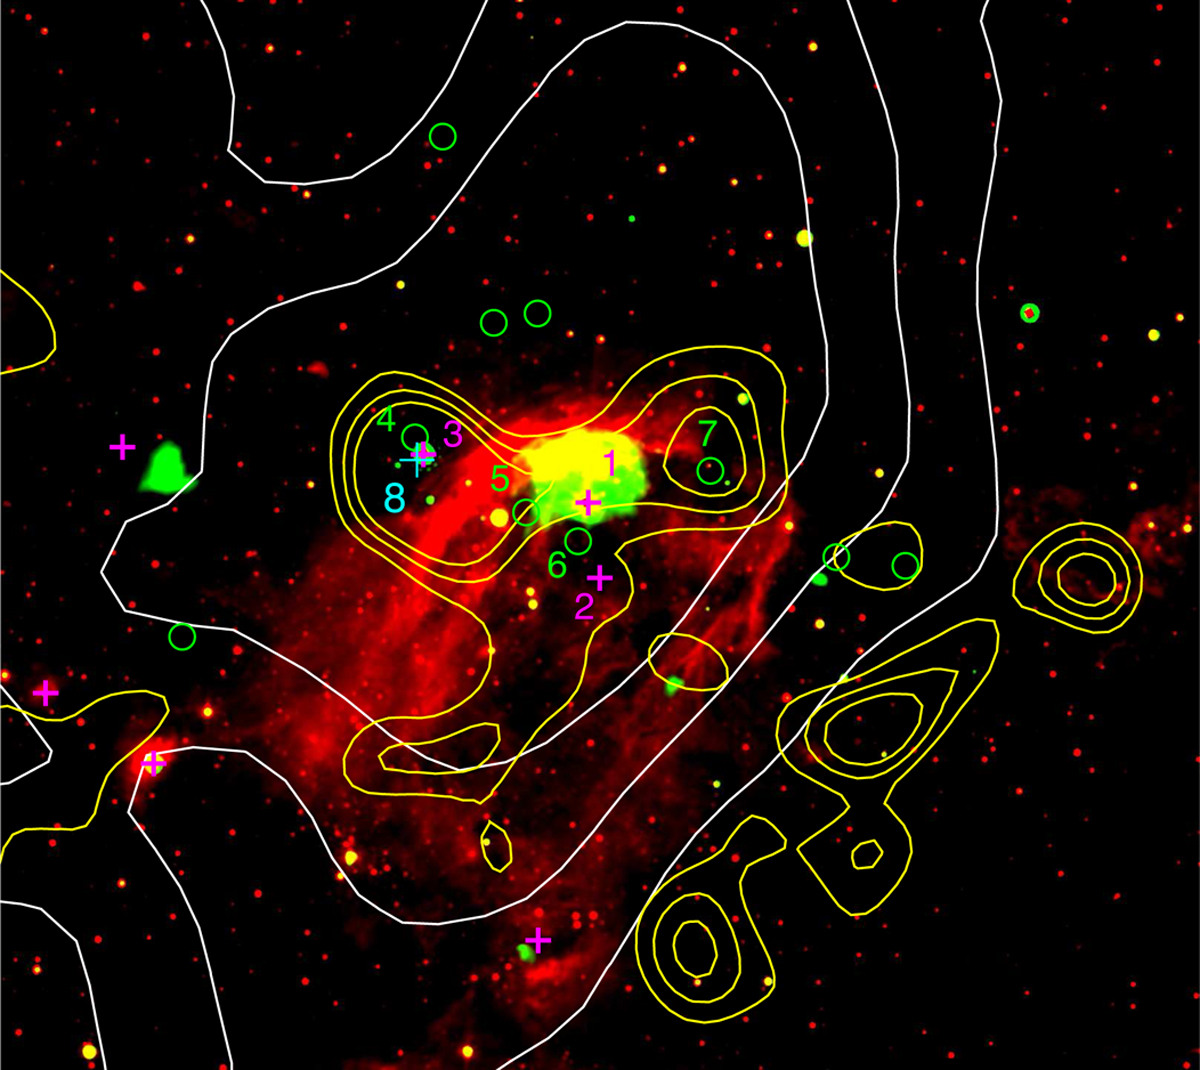
Two-color image of the region indicated by the rectangle of Fig. 5: 8.0 μm (in red), 24.0 μm (in green), and TeV emission (white contours). The yellow contours represent the 13CO emission integrated in the 53–60 km s−1 velocity interval (contour levels: 6.5, 8.3, and 10.4 K km s−1). Magenta crosses indicate the position of the infrared HII regions, green circles the position of the infrared-dark clouds, and the cyan cross the methanol maser. The list of sources is given in Table 4.
Current usage metrics show cumulative count of Article Views (full-text article views including HTML views, PDF and ePub downloads, according to the available data) and Abstracts Views on Vision4Press platform.
Data correspond to usage on the plateform after 2015. The current usage metrics is available 48-96 hours after online publication and is updated daily on week days.
Initial download of the metrics may take a while.