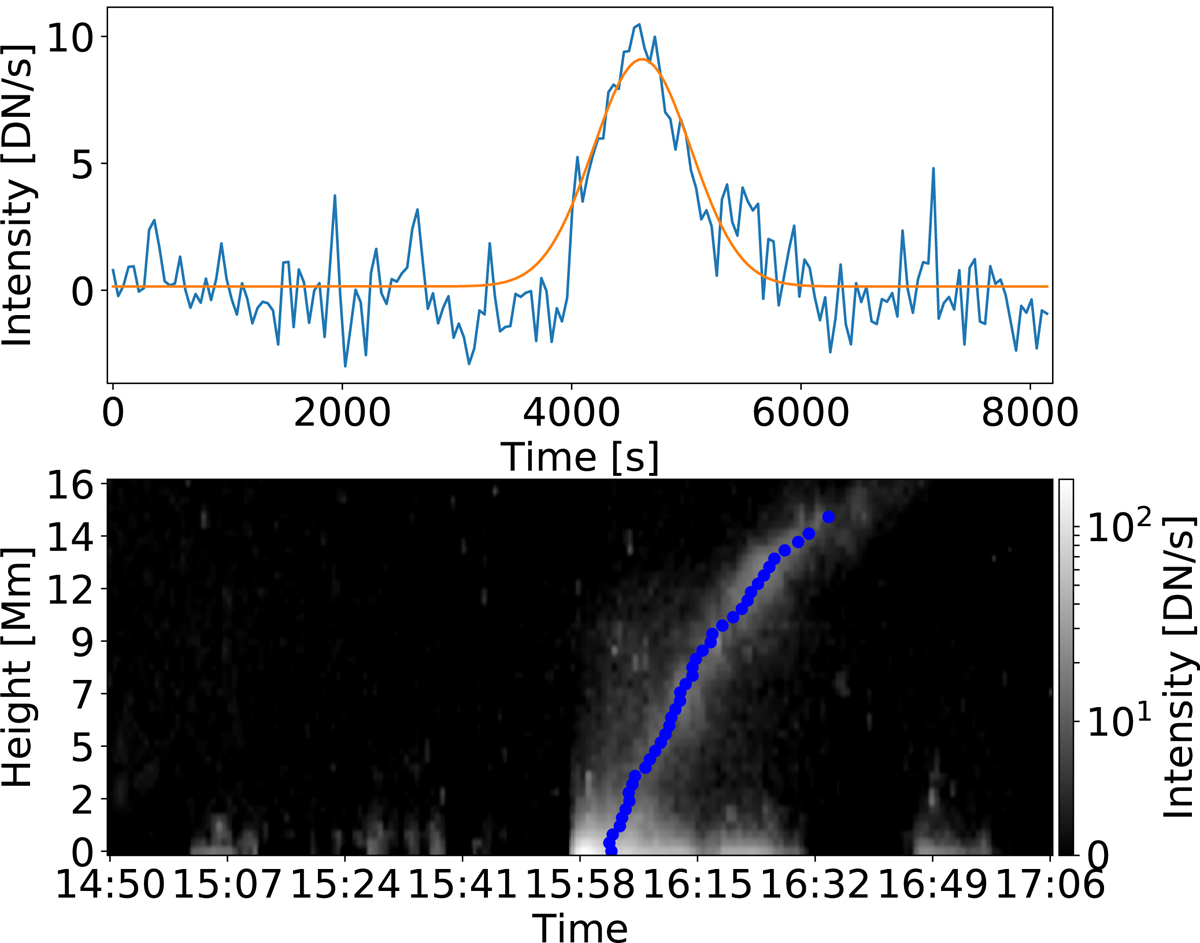
Fig. 4.
Download original image
Gaussian fit for flare SOL2013-05-13T15 (middle panel in Fig. 1). The top panel shows the fit compared to the intensity for a horizontal slice in the middle of the time-distance plot, and the bottom panel shows the trace given by the mean of the Gaussian fit at each height. We can see traces of the spike morphology as an illumination at the bottom of the figure, in addition to the ejection (LPS) morphology, which again is seen as a cloud appearing after the spike.
Current usage metrics show cumulative count of Article Views (full-text article views including HTML views, PDF and ePub downloads, according to the available data) and Abstracts Views on Vision4Press platform.
Data correspond to usage on the plateform after 2015. The current usage metrics is available 48-96 hours after online publication and is updated daily on week days.
Initial download of the metrics may take a while.