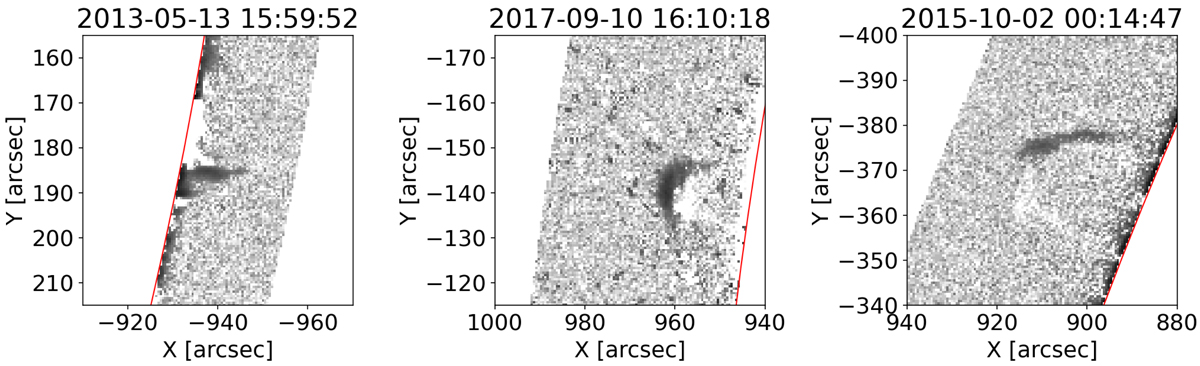
Fig. 1.
Download original image
Example of the spike (left; SOL2013-05-13T01:50), ejection (middle; SOL2017-09-10T), and loop (right; SOL2015-10-02T00:07) coronal flare morphologies. The date and time of each snapshot is listed above each figure. Note the increase in annulus width between 2013 and 2015. These are running difference images, from the 45-second cadence of the original data, with black showing newly appearing emission.
Current usage metrics show cumulative count of Article Views (full-text article views including HTML views, PDF and ePub downloads, according to the available data) and Abstracts Views on Vision4Press platform.
Data correspond to usage on the plateform after 2015. The current usage metrics is available 48-96 hours after online publication and is updated daily on week days.
Initial download of the metrics may take a while.