Fig. 9.
Download original image
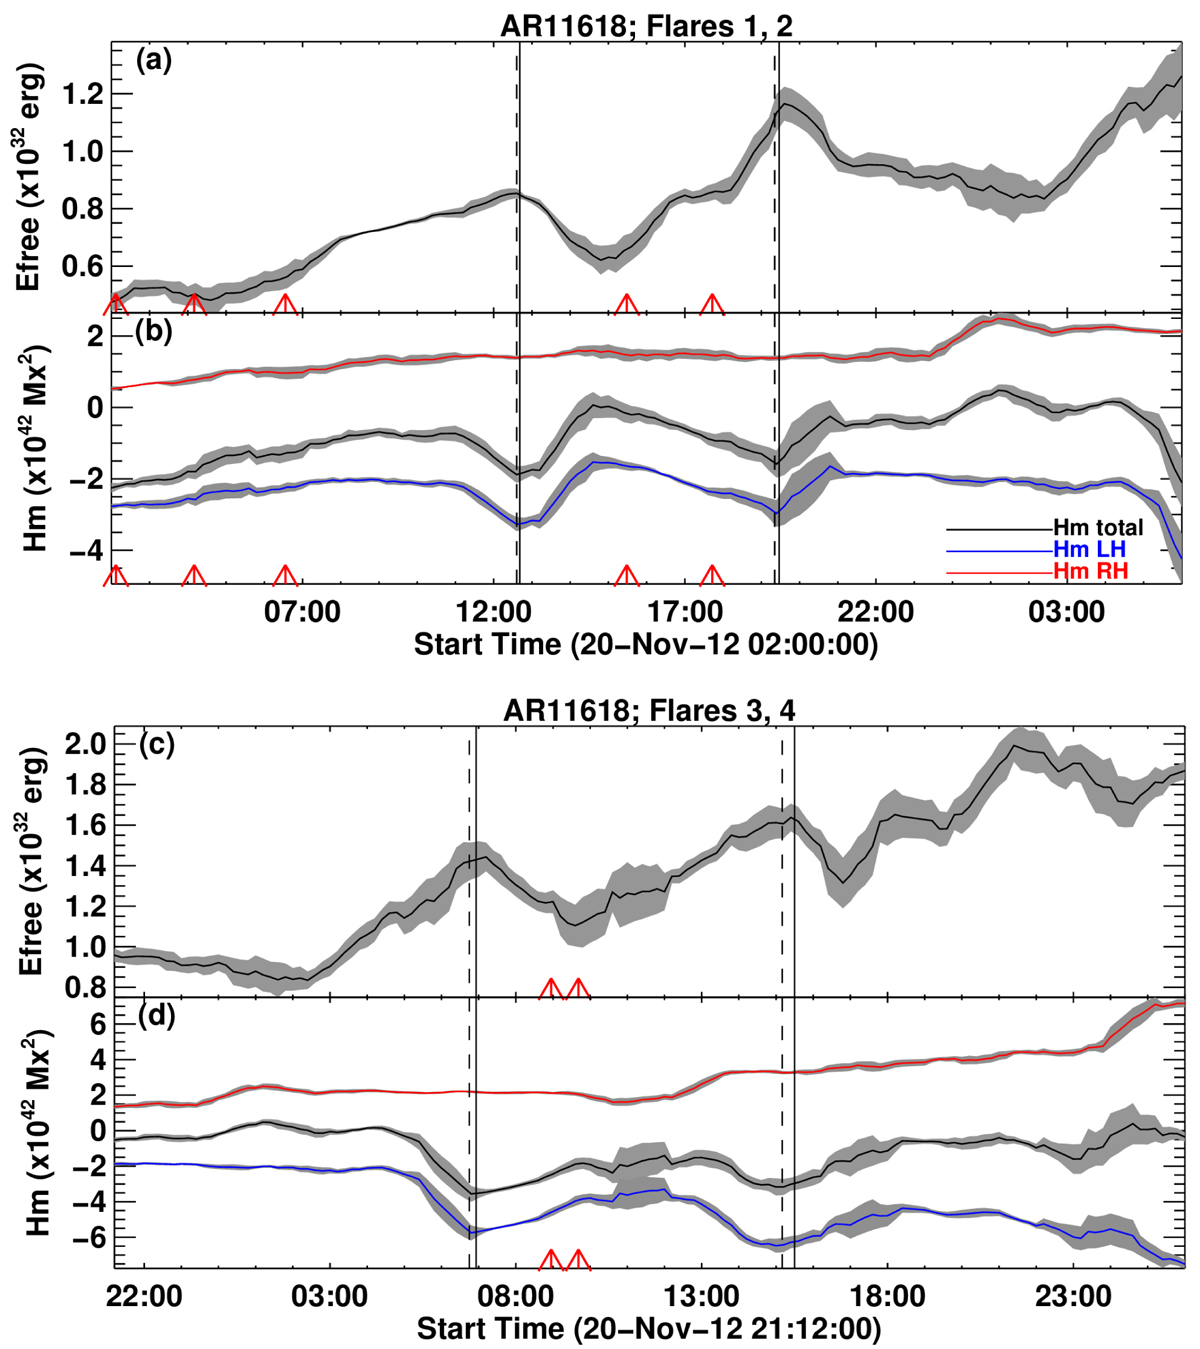
Stack of plots showing the evolution of free magnetic energy (top plot) and of the net, right- and left-handed helicity budgets (bottom plot) for each of the four major eruptive flares in AR11618 a few hours before and after the events. The first and second flares (M1.7 and M1.6, respectively) are shown in plots a, b while the last two flares (M1.4 and M3.5, respectively) are shown in plots c, d.
Current usage metrics show cumulative count of Article Views (full-text article views including HTML views, PDF and ePub downloads, according to the available data) and Abstracts Views on Vision4Press platform.
Data correspond to usage on the plateform after 2015. The current usage metrics is available 48-96 hours after online publication and is updated daily on week days.
Initial download of the metrics may take a while.