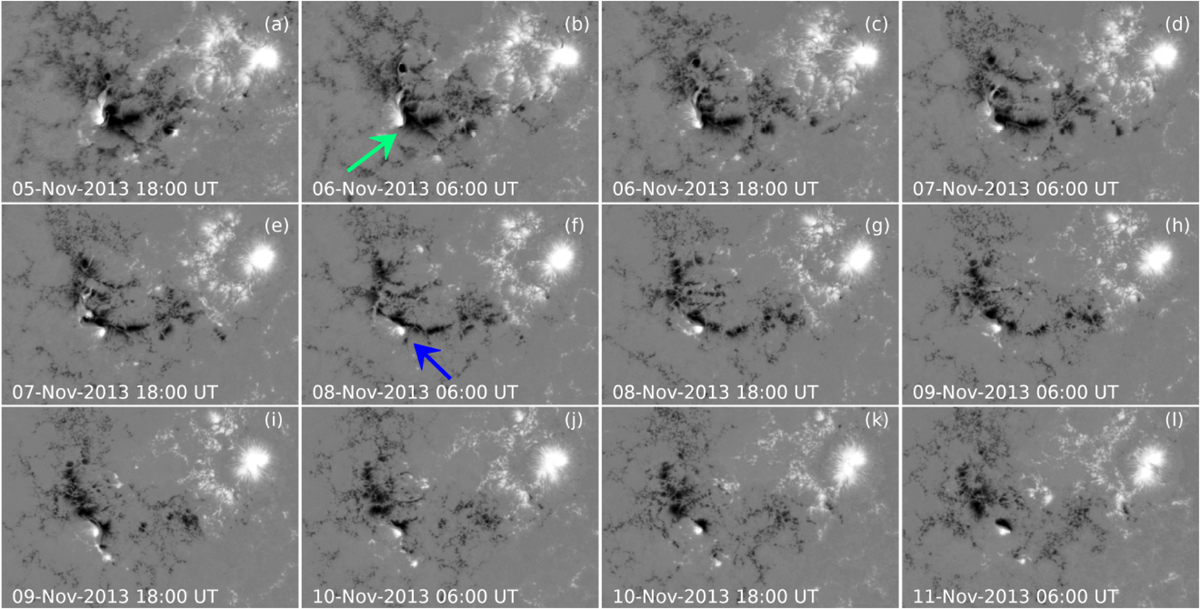
Fig. 1.
Download original image
Selected images of the normal component of the photospheric magnetic field of AR11890 taken by the HMI during the interval studied in this paper. The green arrow marks the area where intense magnetic flux decay occurred, while the blue arrow shows the location of the parasitic positive polarity at a later stage during the flux decay episode. The field of view of each panel is 571″ × 387″. The associated movie is available online.
Current usage metrics show cumulative count of Article Views (full-text article views including HTML views, PDF and ePub downloads, according to the available data) and Abstracts Views on Vision4Press platform.
Data correspond to usage on the plateform after 2015. The current usage metrics is available 48-96 hours after online publication and is updated daily on week days.
Initial download of the metrics may take a while.