Fig. 9
Download original image
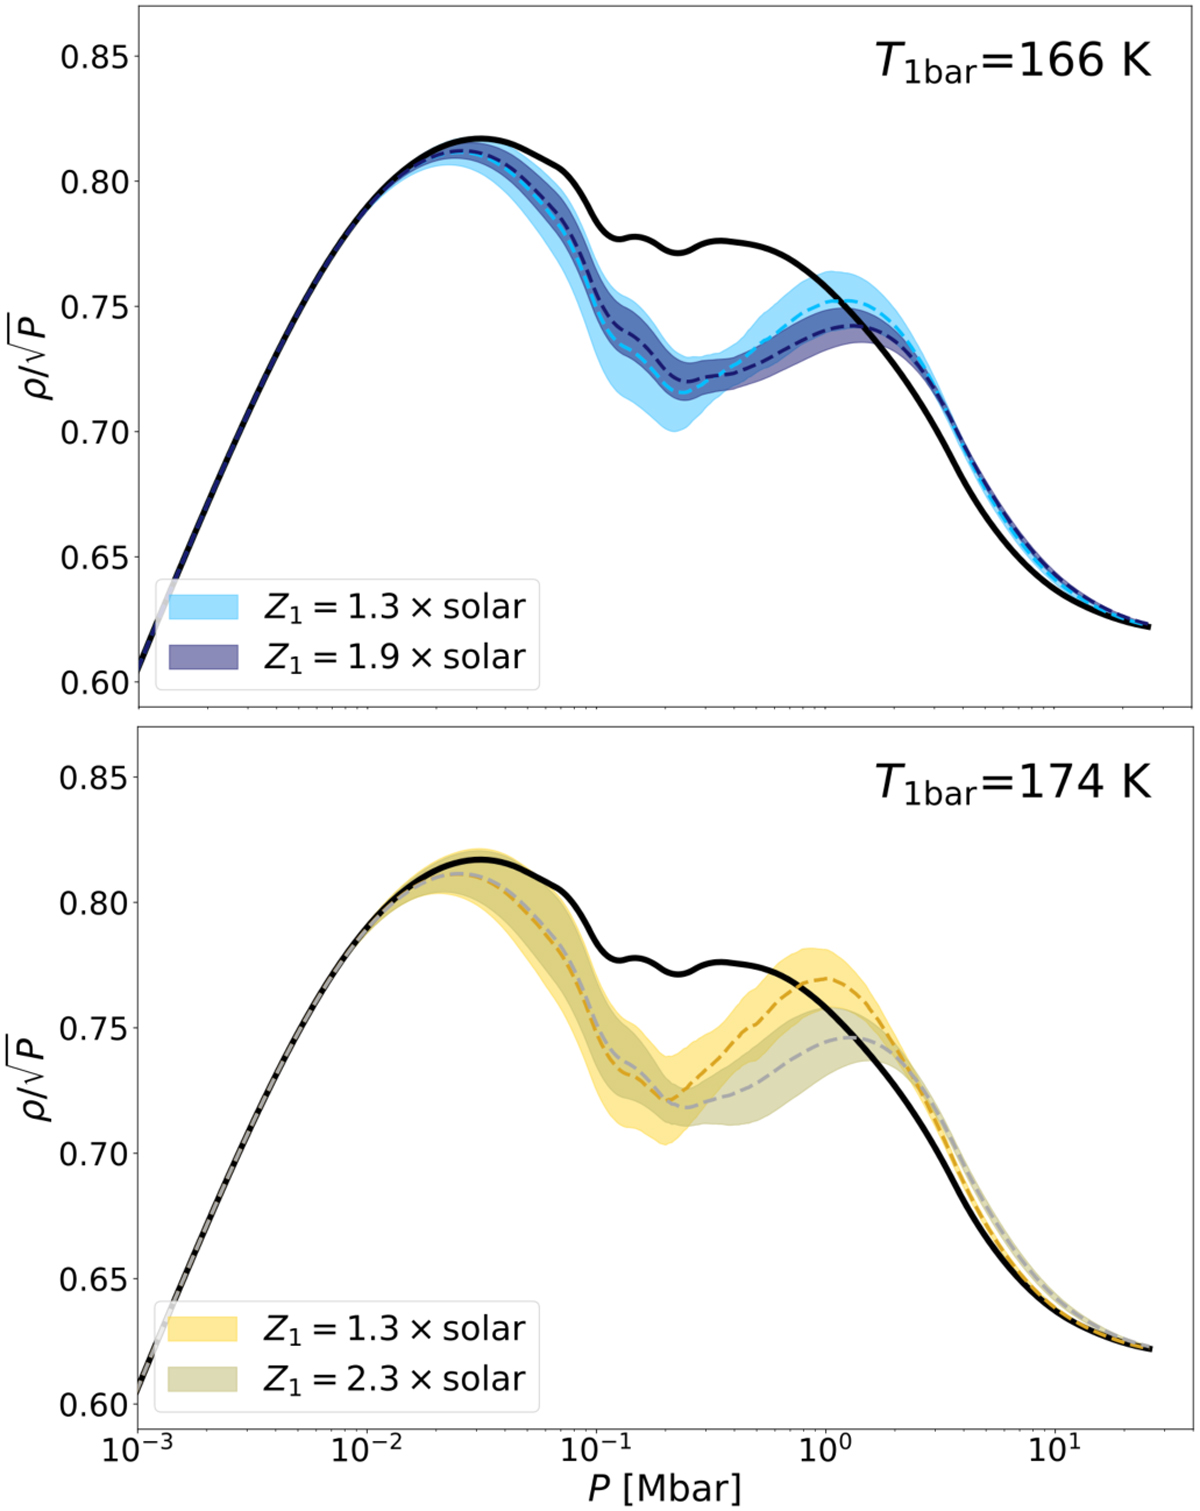
Adiabats obtained for models with modified EOS. Top panel: T1bar is fixed at 166.1 K. The light blue area shows results for Z1 = 0.02 (1.3 × the protosolar value) while dark blue shows results for Z1 = 0.0286 (1.9 × the protosolar value). Bottom panel: T1bar is fixed at 174.1 K. The yellow area shows results for Z1 = 0.02 (1.3 × the protosolar value) while gray shows results for Z1 = 0.035 (2.3 × the protosolar value). The black solid line corresponds to the original MGF16+MH13 EOS. Other details of the figure can be found in the caption of Fig. 8.
Current usage metrics show cumulative count of Article Views (full-text article views including HTML views, PDF and ePub downloads, according to the available data) and Abstracts Views on Vision4Press platform.
Data correspond to usage on the plateform after 2015. The current usage metrics is available 48-96 hours after online publication and is updated daily on week days.
Initial download of the metrics may take a while.