Fig. 8
Download original image
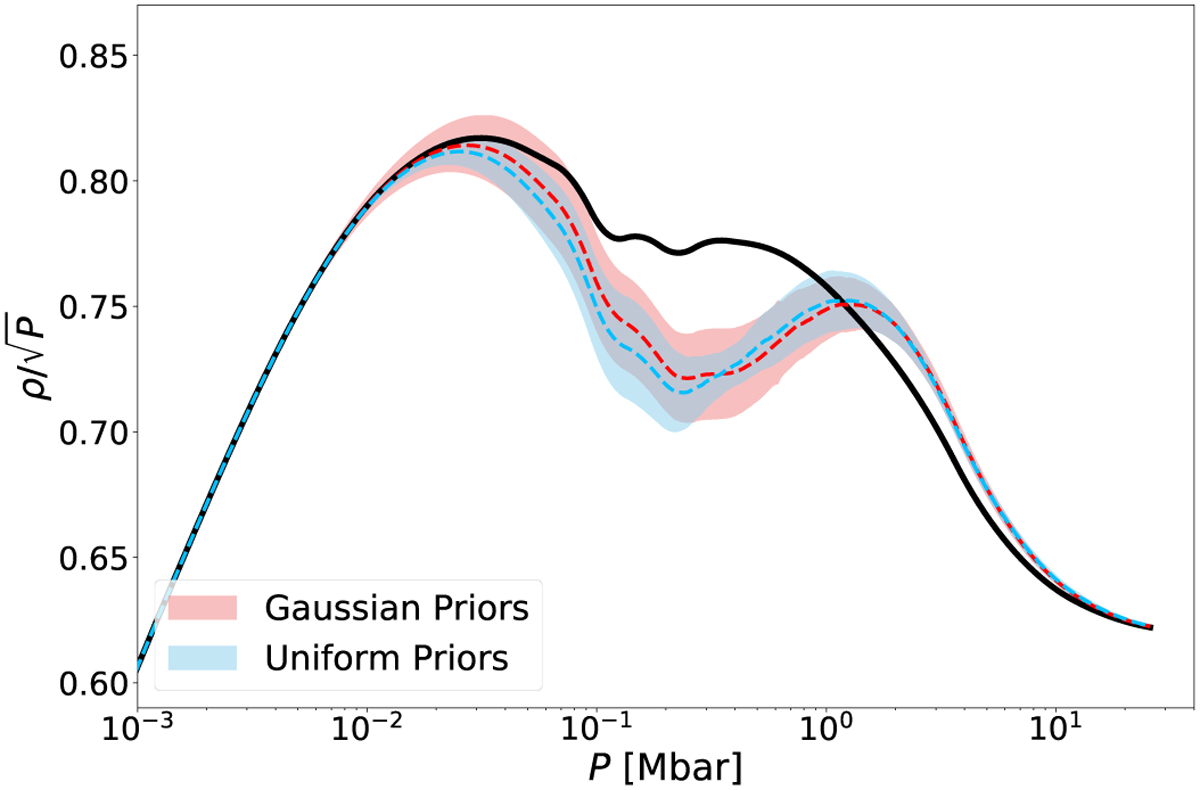
Adiabats obtained for models with a modification of the EOS. The black solid line corresponds to the original MGF16+MH13 EOS. Red shows results obtained with Gaussian priors on ΔP (µ = 0.5 and σ = 0.02) and dρ (µ = 0. and σ = 0.01). Blue shows results obtained with uniform priors. The prior on Pmodif remains uniform in both cases. The dashed lines correspond to the adiabat obtained with the mean values of Pmodif, ΔP, and dρ (see Sect. 3.3) of a subsample of 100 models randomly drawn from the MCMC output. We compute the standard deviation (σ) of the 100 adiabats and the envelopes show the adiabats of the 1σ spread from the mean modified adiabat (dashed line). Here, T1bar is fixed at 166.1 K.
Current usage metrics show cumulative count of Article Views (full-text article views including HTML views, PDF and ePub downloads, according to the available data) and Abstracts Views on Vision4Press platform.
Data correspond to usage on the plateform after 2015. The current usage metrics is available 48-96 hours after online publication and is updated daily on week days.
Initial download of the metrics may take a while.