Fig. 7
Download original image
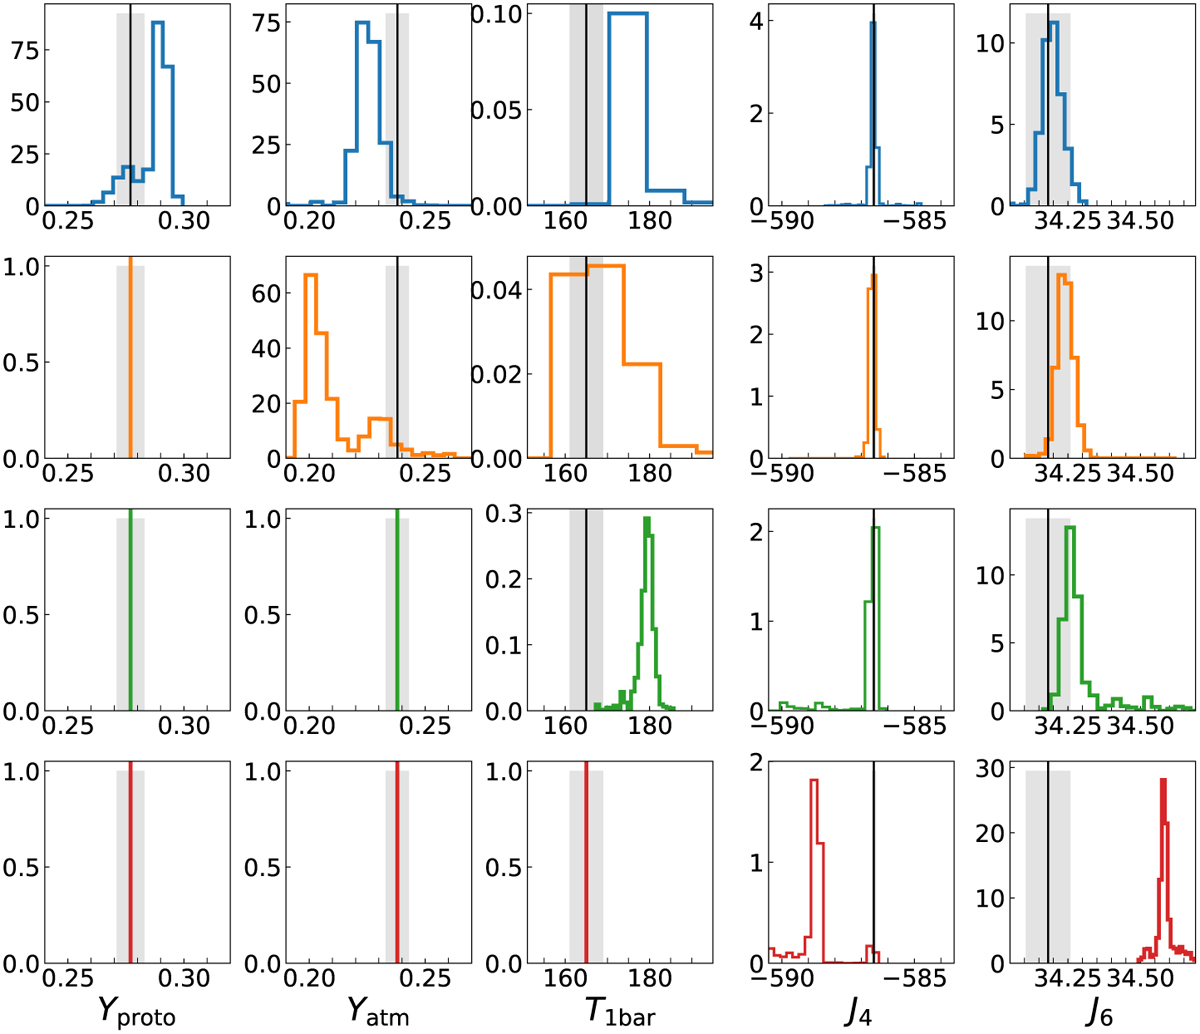
Posterior distributions of Yproto, Yatm. T1bar, J4, and J6 for four different MCMC runs using the MGF16+MH13 EOS. The blue histograms correspond to a run where the four parameters are free. In the orange run, Yproto is fixed. In the green run, Yproto and Yatm are fixed. In the red run, Yproto, Yatm, and T1bar are fixed. When histograms show a black vertical solid line, this indicates that a prior was set and was centred at the value from observations (Yproto = 0.277 ± 0.006, Yatm = 0.238 ± 0.005, T1bar = 165 ± 4K, J4.106 = −586.53 ± 0.0836 and J6.106 = 34.18 ± 0.07682). The gray areas correspond to the standard deviation of the prior (1 sigma).
Current usage metrics show cumulative count of Article Views (full-text article views including HTML views, PDF and ePub downloads, according to the available data) and Abstracts Views on Vision4Press platform.
Data correspond to usage on the plateform after 2015. The current usage metrics is available 48-96 hours after online publication and is updated daily on week days.
Initial download of the metrics may take a while.