Fig. 5
Download original image
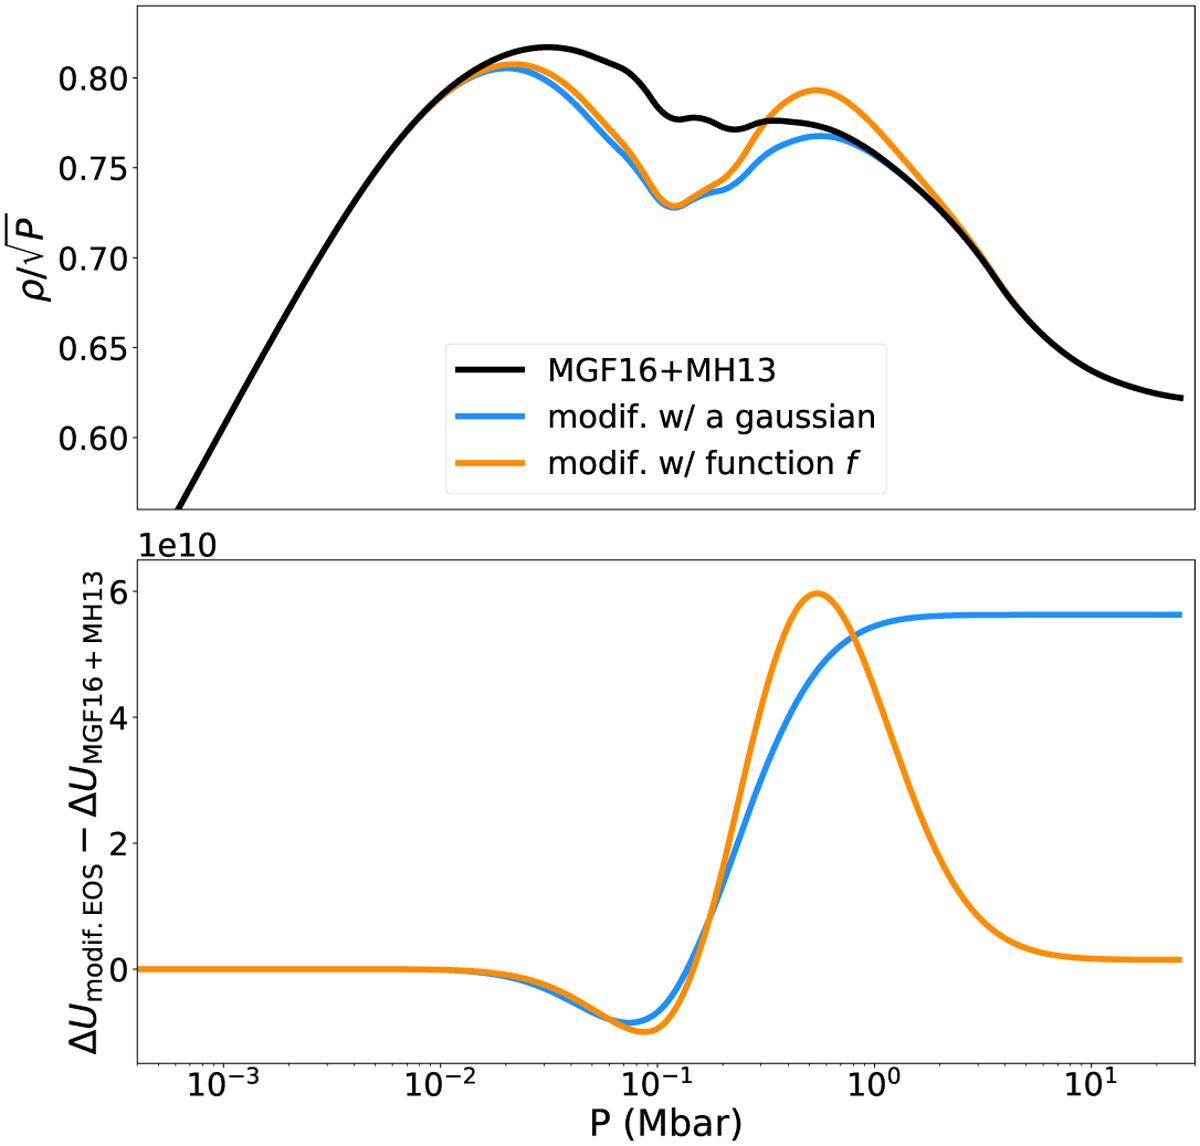
Comparisons of the ΔU difference for a model modified with only a Gaussian function (blue) and a model modified with the defined function f (see Eq. (9)) composed of a Gaussian and an error function (orange). Top panel: comparison of the adiabats (Pmodif = 1011 dyn cm−2, ΔP = 0.5, dρ = −0.06 for the blue curve & Pmodif = 1011.5 dyn cnr−2, ΔP = 0.6, dρ = −0.05). Bottom panel: difference between the ΔU of the modified models and that of the reference model (MH13).
Current usage metrics show cumulative count of Article Views (full-text article views including HTML views, PDF and ePub downloads, according to the available data) and Abstracts Views on Vision4Press platform.
Data correspond to usage on the plateform after 2015. The current usage metrics is available 48-96 hours after online publication and is updated daily on week days.
Initial download of the metrics may take a while.