Open Access
Fig. 6
Download original image
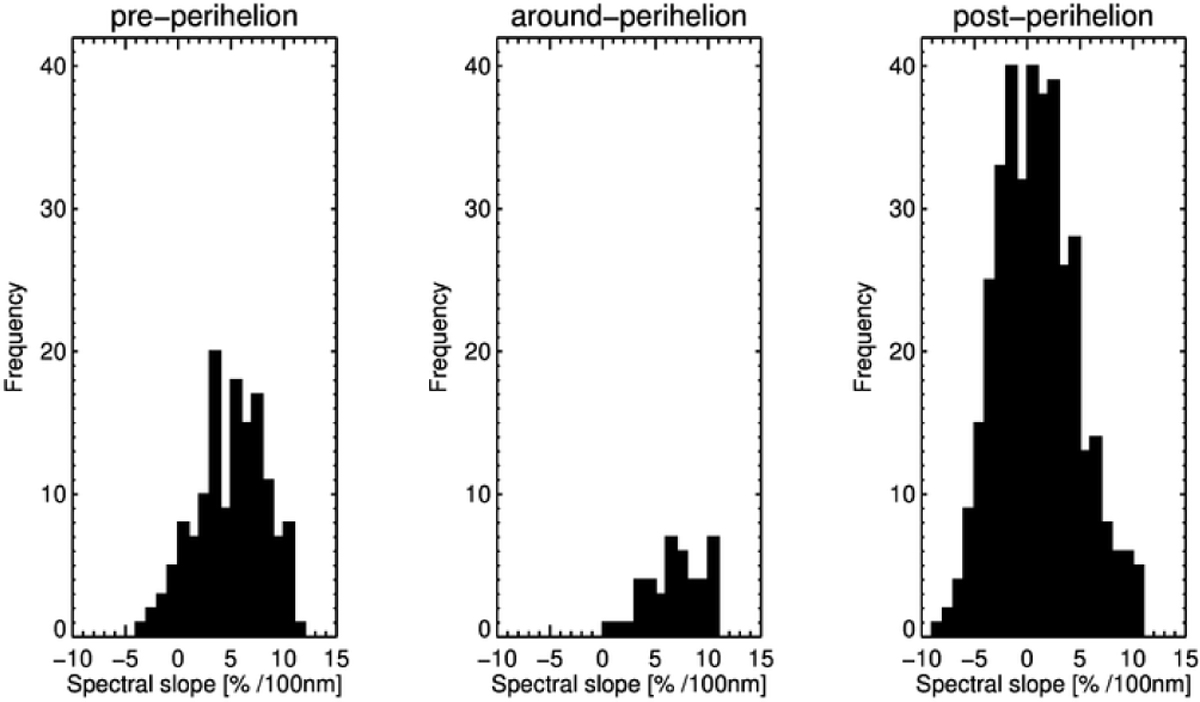
Histograms showing the bright spot spectral slopes, evaluated in the 535–882 nm wavelength range, pre-perihelion (August 2014–May 2015), during perihelion (June–October 2015), and post-perihelion (November 2015–September 2016).
Current usage metrics show cumulative count of Article Views (full-text article views including HTML views, PDF and ePub downloads, according to the available data) and Abstracts Views on Vision4Press platform.
Data correspond to usage on the plateform after 2015. The current usage metrics is available 48-96 hours after online publication and is updated daily on week days.
Initial download of the metrics may take a while.