Open Access
Fig. 2
Download original image
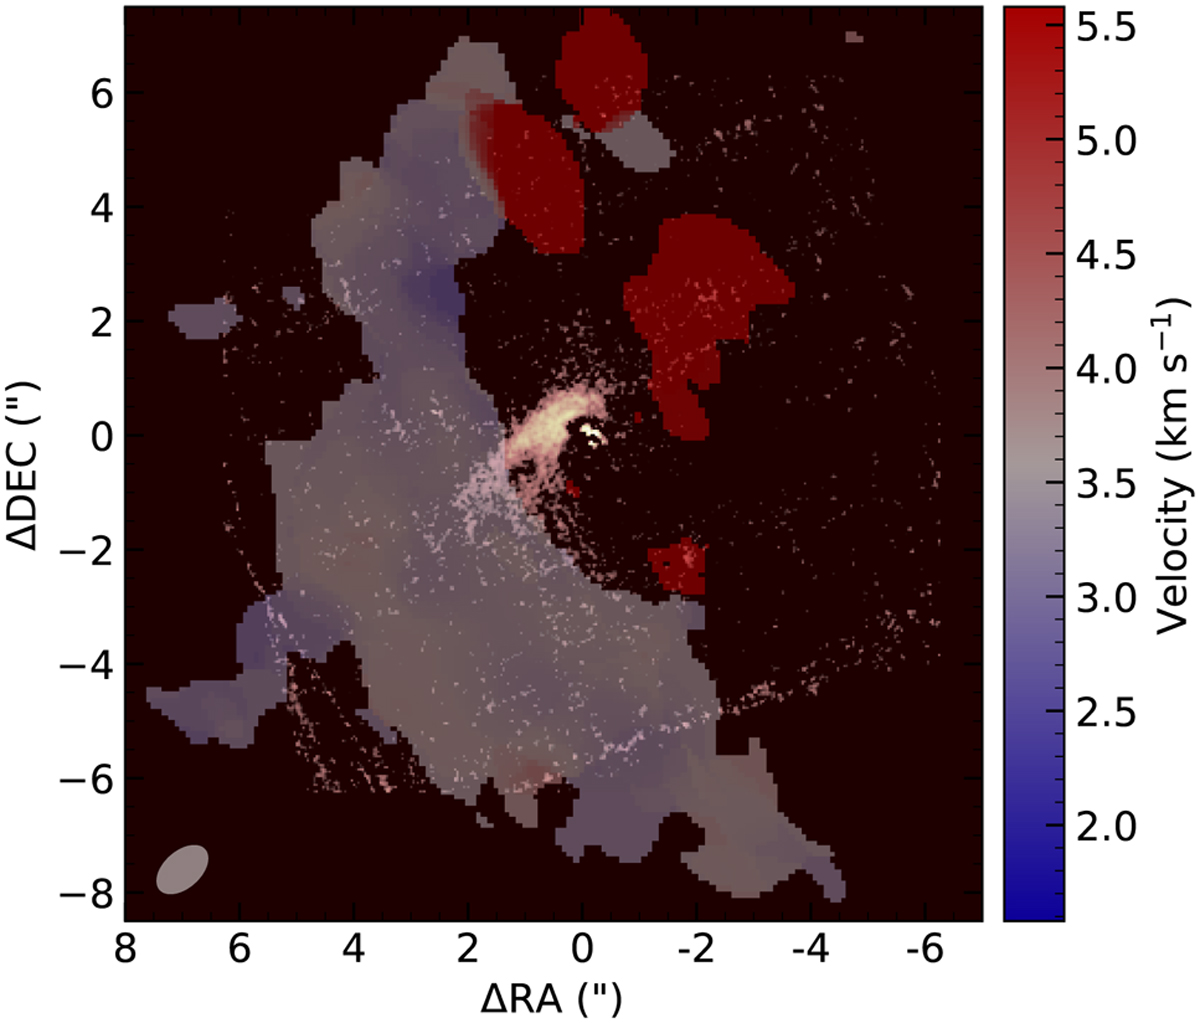
Overlay of SPHERE scattered-light image (background) and the ALMA moment 1 map of CO gas emission of CHX 22 (colormap centered on the systemic velocity of ~3.6 km s−1). The gray ellipse denotes the beam (1.07″× 0.65″) of ALMA observations.
Current usage metrics show cumulative count of Article Views (full-text article views including HTML views, PDF and ePub downloads, according to the available data) and Abstracts Views on Vision4Press platform.
Data correspond to usage on the plateform after 2015. The current usage metrics is available 48-96 hours after online publication and is updated daily on week days.
Initial download of the metrics may take a while.