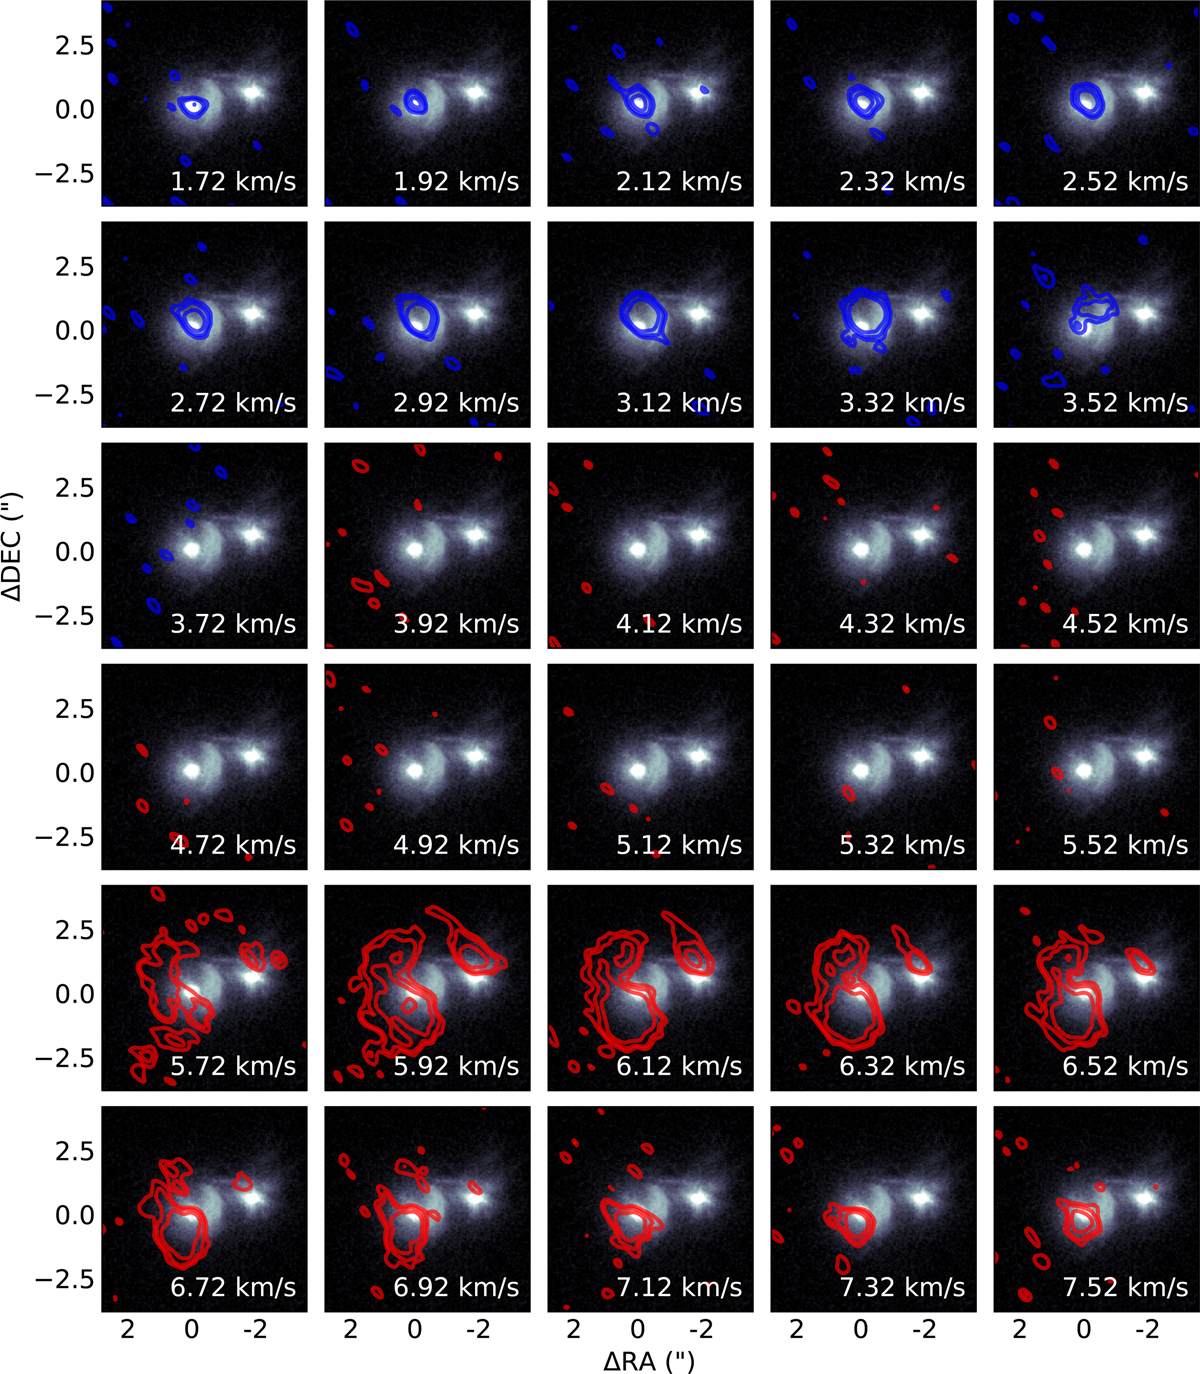
Fig. D.1
Download original image
SPHERE PI image of HP Cha with the ALMA CO J = 3 − 2 channel maps as contours. The contours delineate the flux level of [3, 5, 10, 50]σ, where σ is the standard deviation as measured in the image background. The contours of channels redshifted relative to the systemic velocity (~3.8 km s−1) are shown in red, and blueshifted channels are shown in blue.
Current usage metrics show cumulative count of Article Views (full-text article views including HTML views, PDF and ePub downloads, according to the available data) and Abstracts Views on Vision4Press platform.
Data correspond to usage on the plateform after 2015. The current usage metrics is available 48-96 hours after online publication and is updated daily on week days.
Initial download of the metrics may take a while.