Fig. 8
Download original image
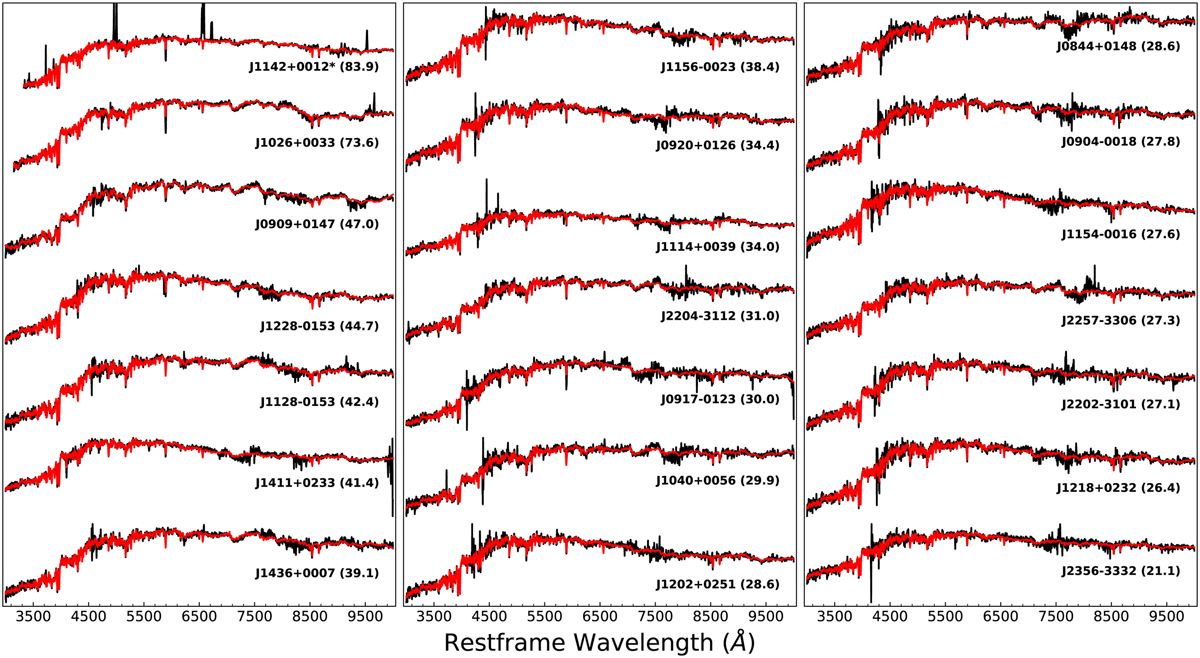
Fiducial best fit (red) over-plotted on the combined and smoothed galaxy spectra (red) for all the systems in DR2 ordered from high to low S/N (left to right and top to bottom). Noisier regions around 4300–4500 Å and around 7500–8000 Å show the wavelength at which the different arms were joined. * For clarity of the stellar continuum best fit, the peaks of the strong emission lines in the spectrum of J1142+0012 are cut in the plot.
Current usage metrics show cumulative count of Article Views (full-text article views including HTML views, PDF and ePub downloads, according to the available data) and Abstracts Views on Vision4Press platform.
Data correspond to usage on the plateform after 2015. The current usage metrics is available 48-96 hours after online publication and is updated daily on week days.
Initial download of the metrics may take a while.