Open Access
Fig. 4
Download original image
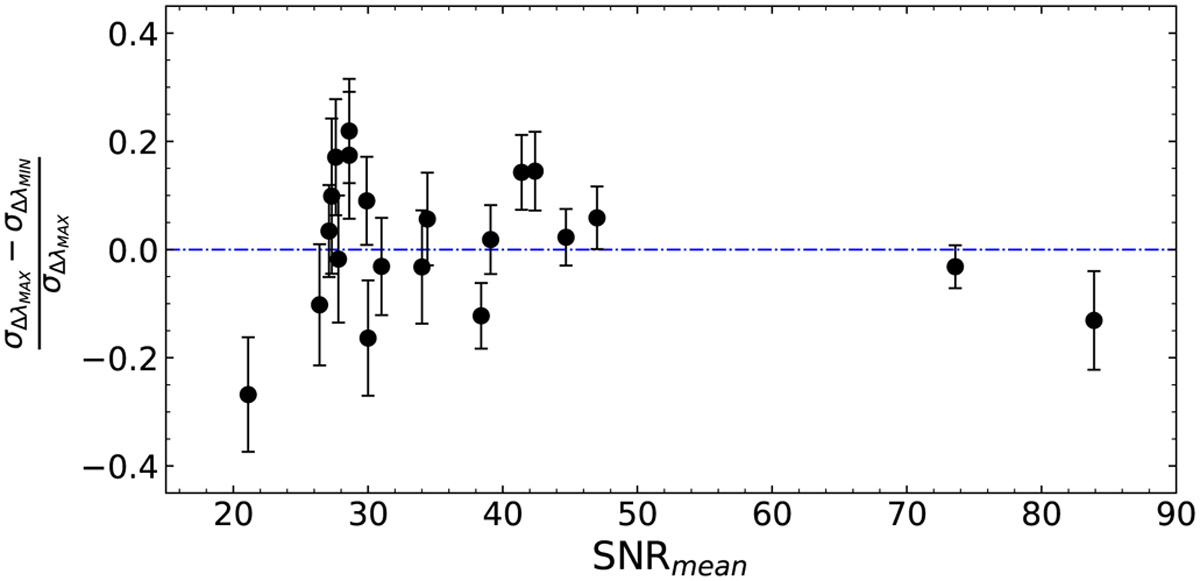
Fit range test. The plot displays the relative difference in σ between the measurements obtained by fitting the widest and narrowest wavelength range. For spectra with a lower S/N, the spread is larger and the variation in the velocity dispersion is in some cases as high as 20%.
Current usage metrics show cumulative count of Article Views (full-text article views including HTML views, PDF and ePub downloads, according to the available data) and Abstracts Views on Vision4Press platform.
Data correspond to usage on the plateform after 2015. The current usage metrics is available 48-96 hours after online publication and is updated daily on week days.
Initial download of the metrics may take a while.