Fig. 2
Download original image
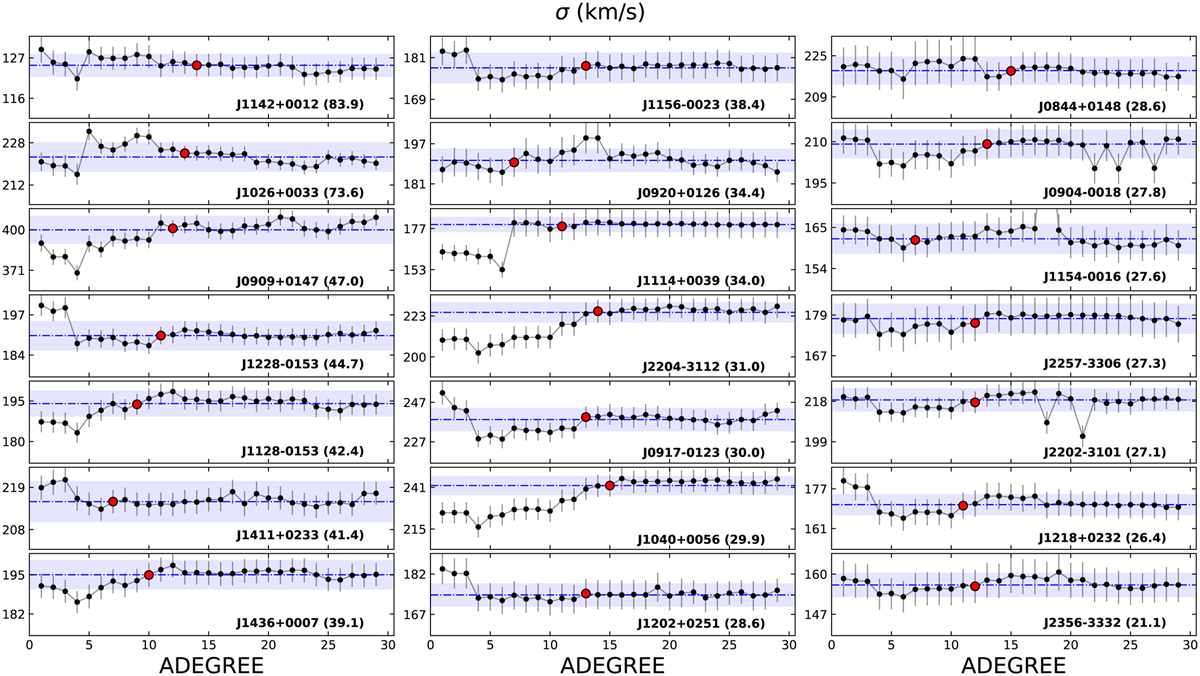
ADEGREE test: Variation in the measured σ as a function of the degree of the additive polynomial. The spectra are ordered from top to bottom and from left to right in descending S/N (shown in each panel in parentheses). The larger red dots are the ADEGREE chosen for the fiducial fit, and the shaded blue region shows a variation on the σ from the median value of ±2.5%.
Current usage metrics show cumulative count of Article Views (full-text article views including HTML views, PDF and ePub downloads, according to the available data) and Abstracts Views on Vision4Press platform.
Data correspond to usage on the plateform after 2015. The current usage metrics is available 48-96 hours after online publication and is updated daily on week days.
Initial download of the metrics may take a while.