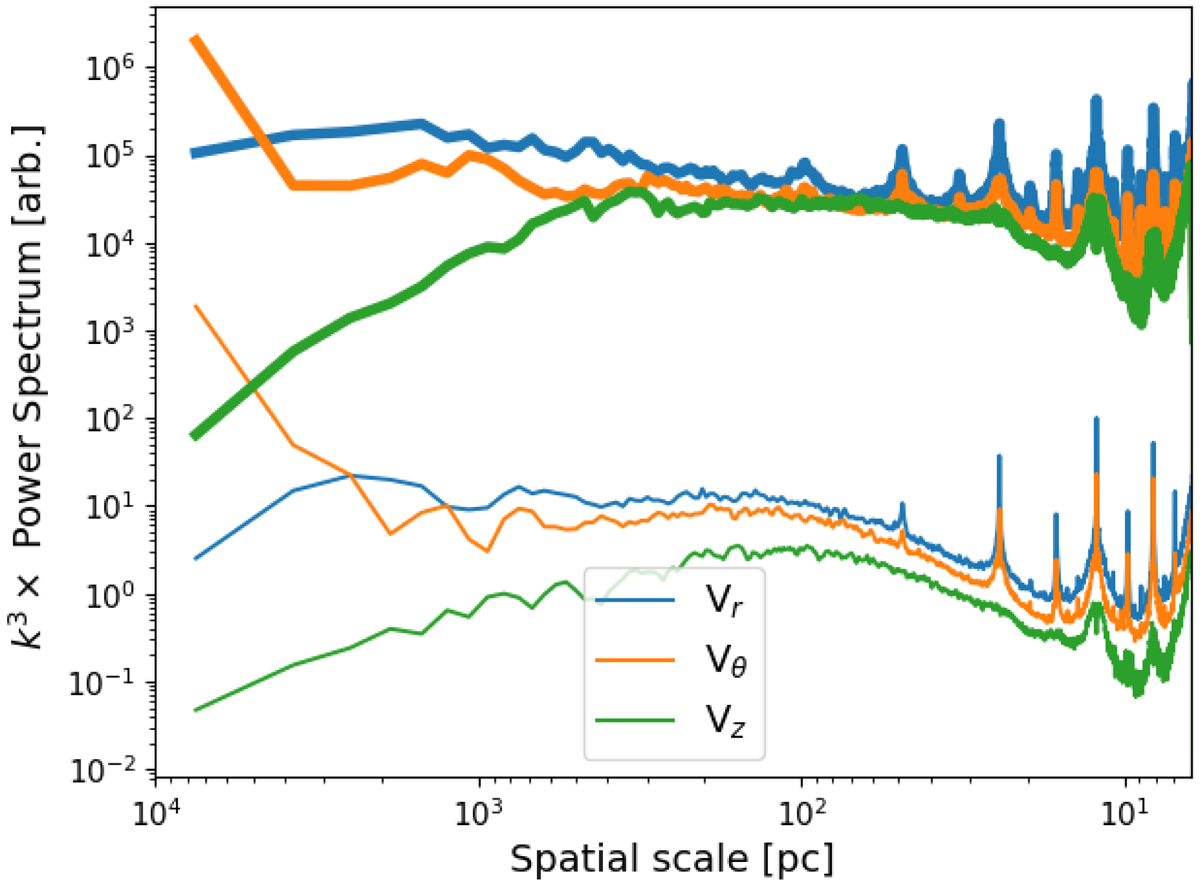
Fig. 4.
Download original image
Power spectra of the three velocity components from face-on mass-weighted velocity projection maps. The spectra are compensated by k3. The F65 model is shown with bold lines, and the F10 model is plotted with thin lines. The F10 power spectra are shifted down by 3 dex for clarity. The spikes seen at the small spatial scales are due to oversampling because of the AMR grid out of which the Fourier transform was performed. These spectra show that the injection scale of turbulence is indeed different in the two models, and corresponds roughly to the disk scale height.
Current usage metrics show cumulative count of Article Views (full-text article views including HTML views, PDF and ePub downloads, according to the available data) and Abstracts Views on Vision4Press platform.
Data correspond to usage on the plateform after 2015. The current usage metrics is available 48-96 hours after online publication and is updated daily on week days.
Initial download of the metrics may take a while.