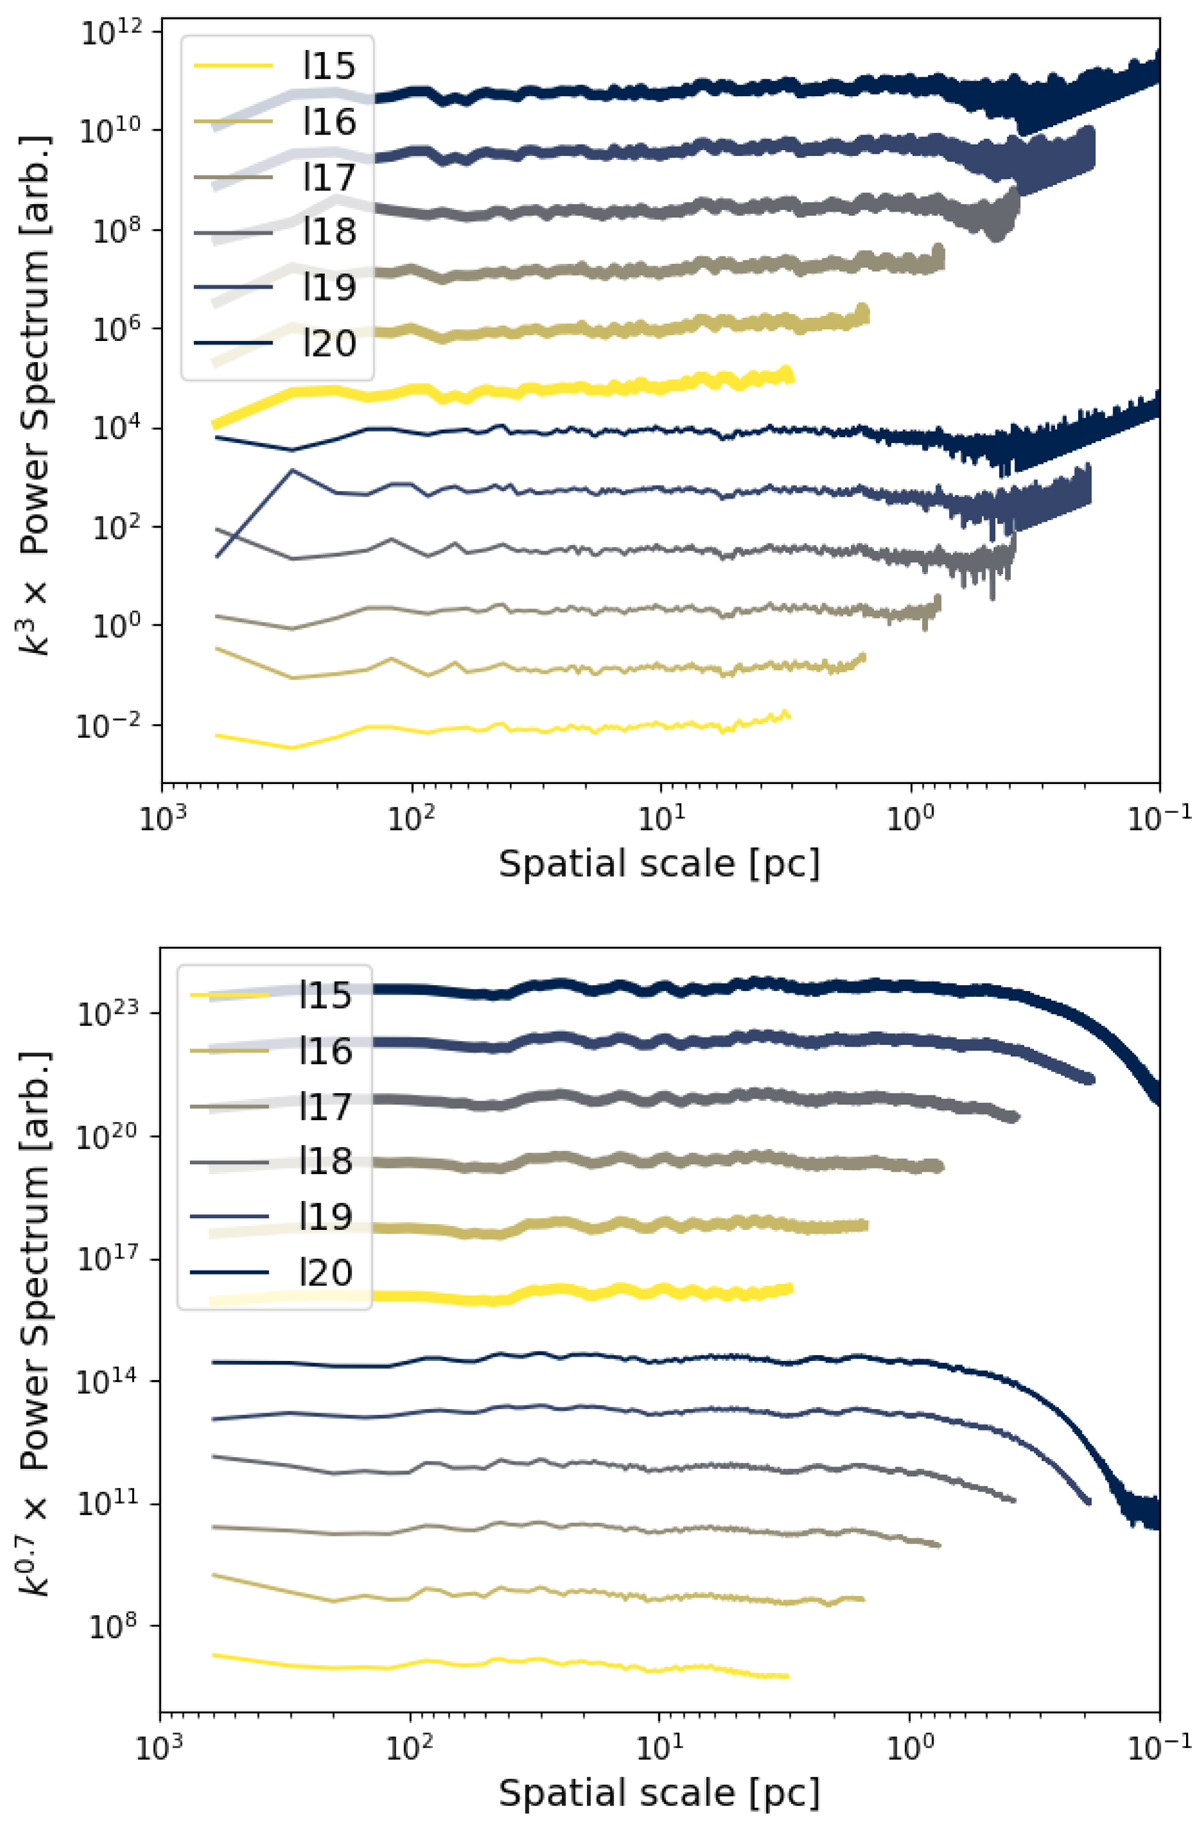
Fig. A.1.
Download original image
Compensated power spectra computed with on 2D maps for the maps shown in Fig. 5. The upper and lower panels show altitudinal velocity and surface density power spectra, respectively. Each colour corresponds to a different highest resolution of the cells, varying from level 20 down to level 15, which corresponds to a uniform grid. Power spectra in bold and thin lines correspond to the F65 and F10 runs, respectively. The latter are all shifted down by 5 dex for clarity.
Current usage metrics show cumulative count of Article Views (full-text article views including HTML views, PDF and ePub downloads, according to the available data) and Abstracts Views on Vision4Press platform.
Data correspond to usage on the plateform after 2015. The current usage metrics is available 48-96 hours after online publication and is updated daily on week days.
Initial download of the metrics may take a while.