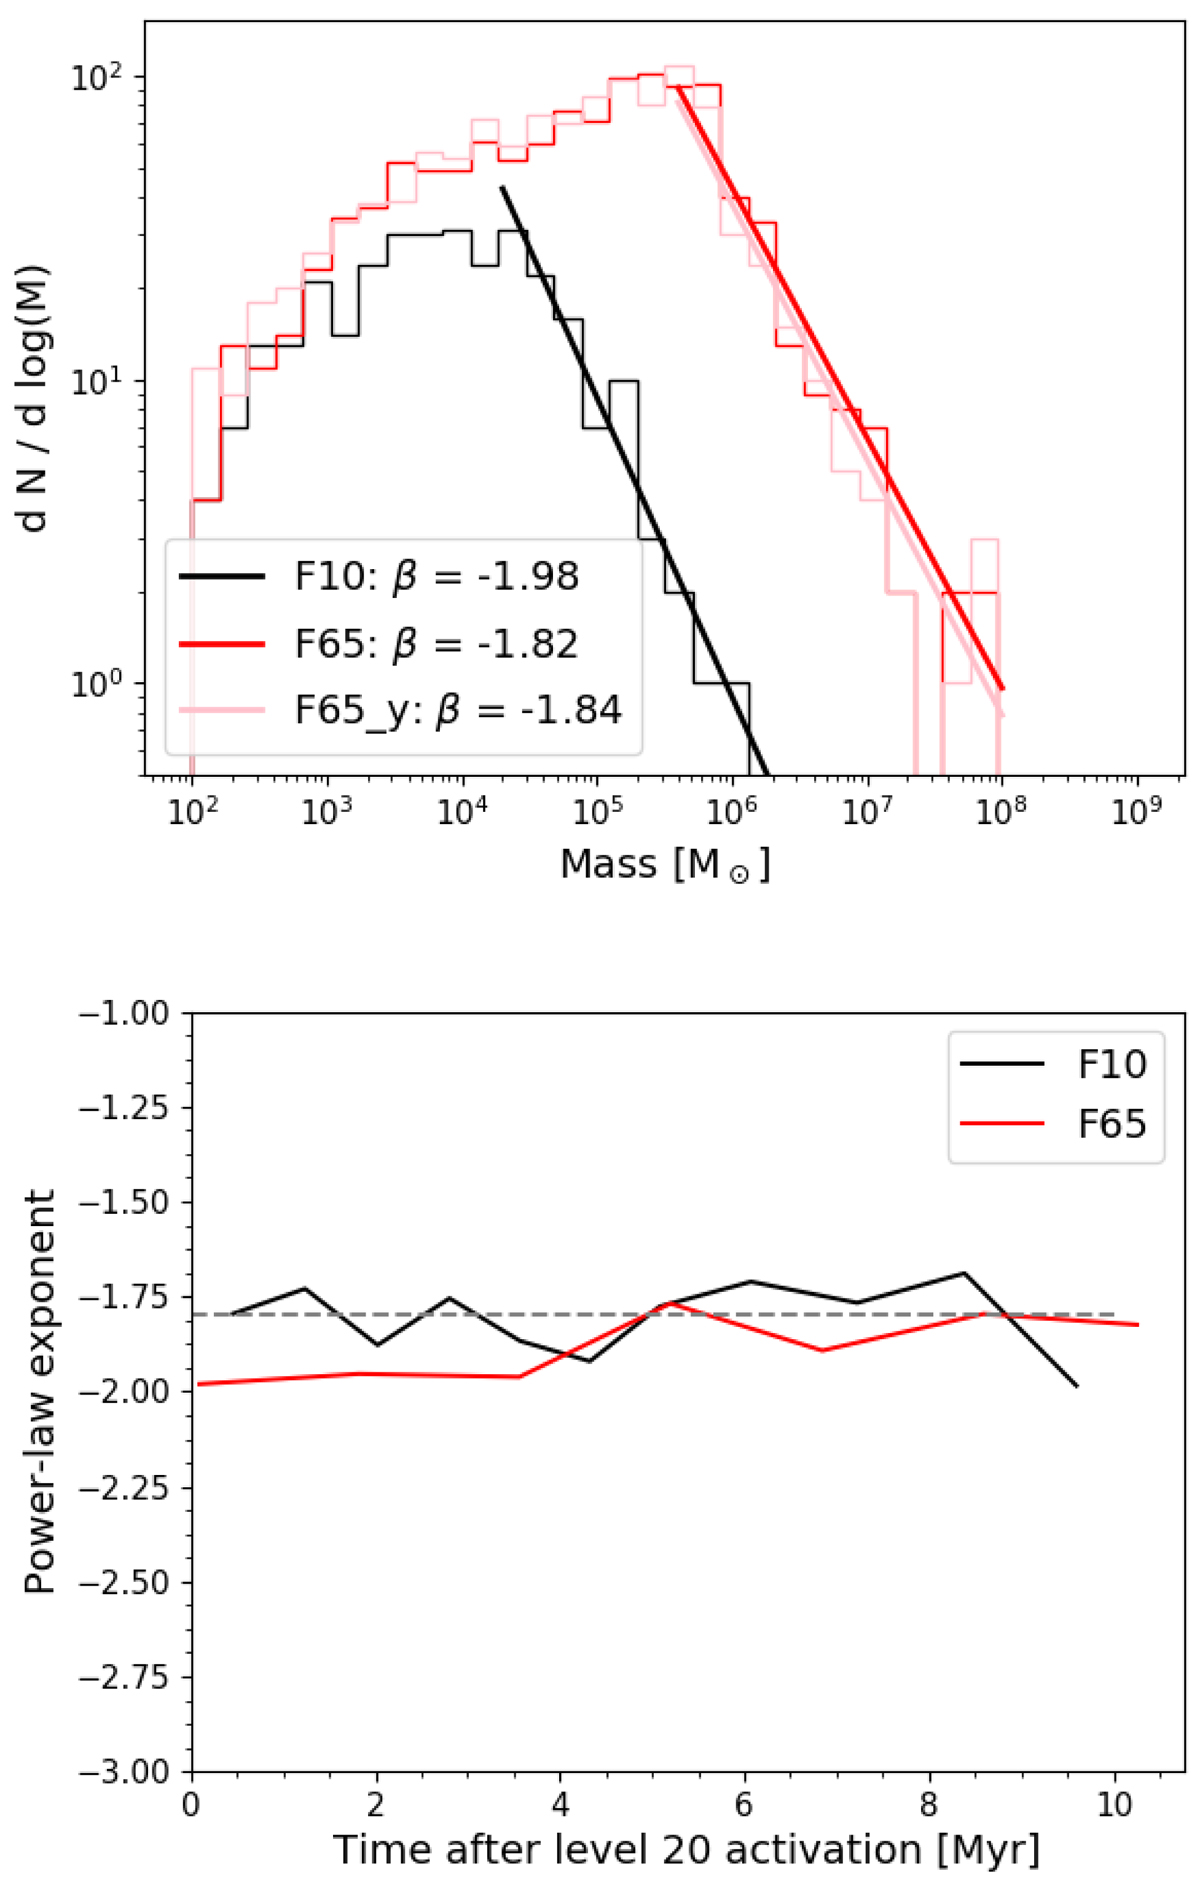
Fig. 13.
Download original image
Mass spectrum of the substructures for the two simulations. Top panel: mass spectrum of the bound structures in the zoom (αvir < 2). The pink histogram and fit are obtained for a detection performed on the edge-on density map. The power slopes are parametrised by dN/dM ∝ M−β. Bottom panel: evolution of the slope of the power-law fit to the high-mass end of the mass spectrum. The dashed grey line shows the location of the −1.8 exponent.
Current usage metrics show cumulative count of Article Views (full-text article views including HTML views, PDF and ePub downloads, according to the available data) and Abstracts Views on Vision4Press platform.
Data correspond to usage on the plateform after 2015. The current usage metrics is available 48-96 hours after online publication and is updated daily on week days.
Initial download of the metrics may take a while.