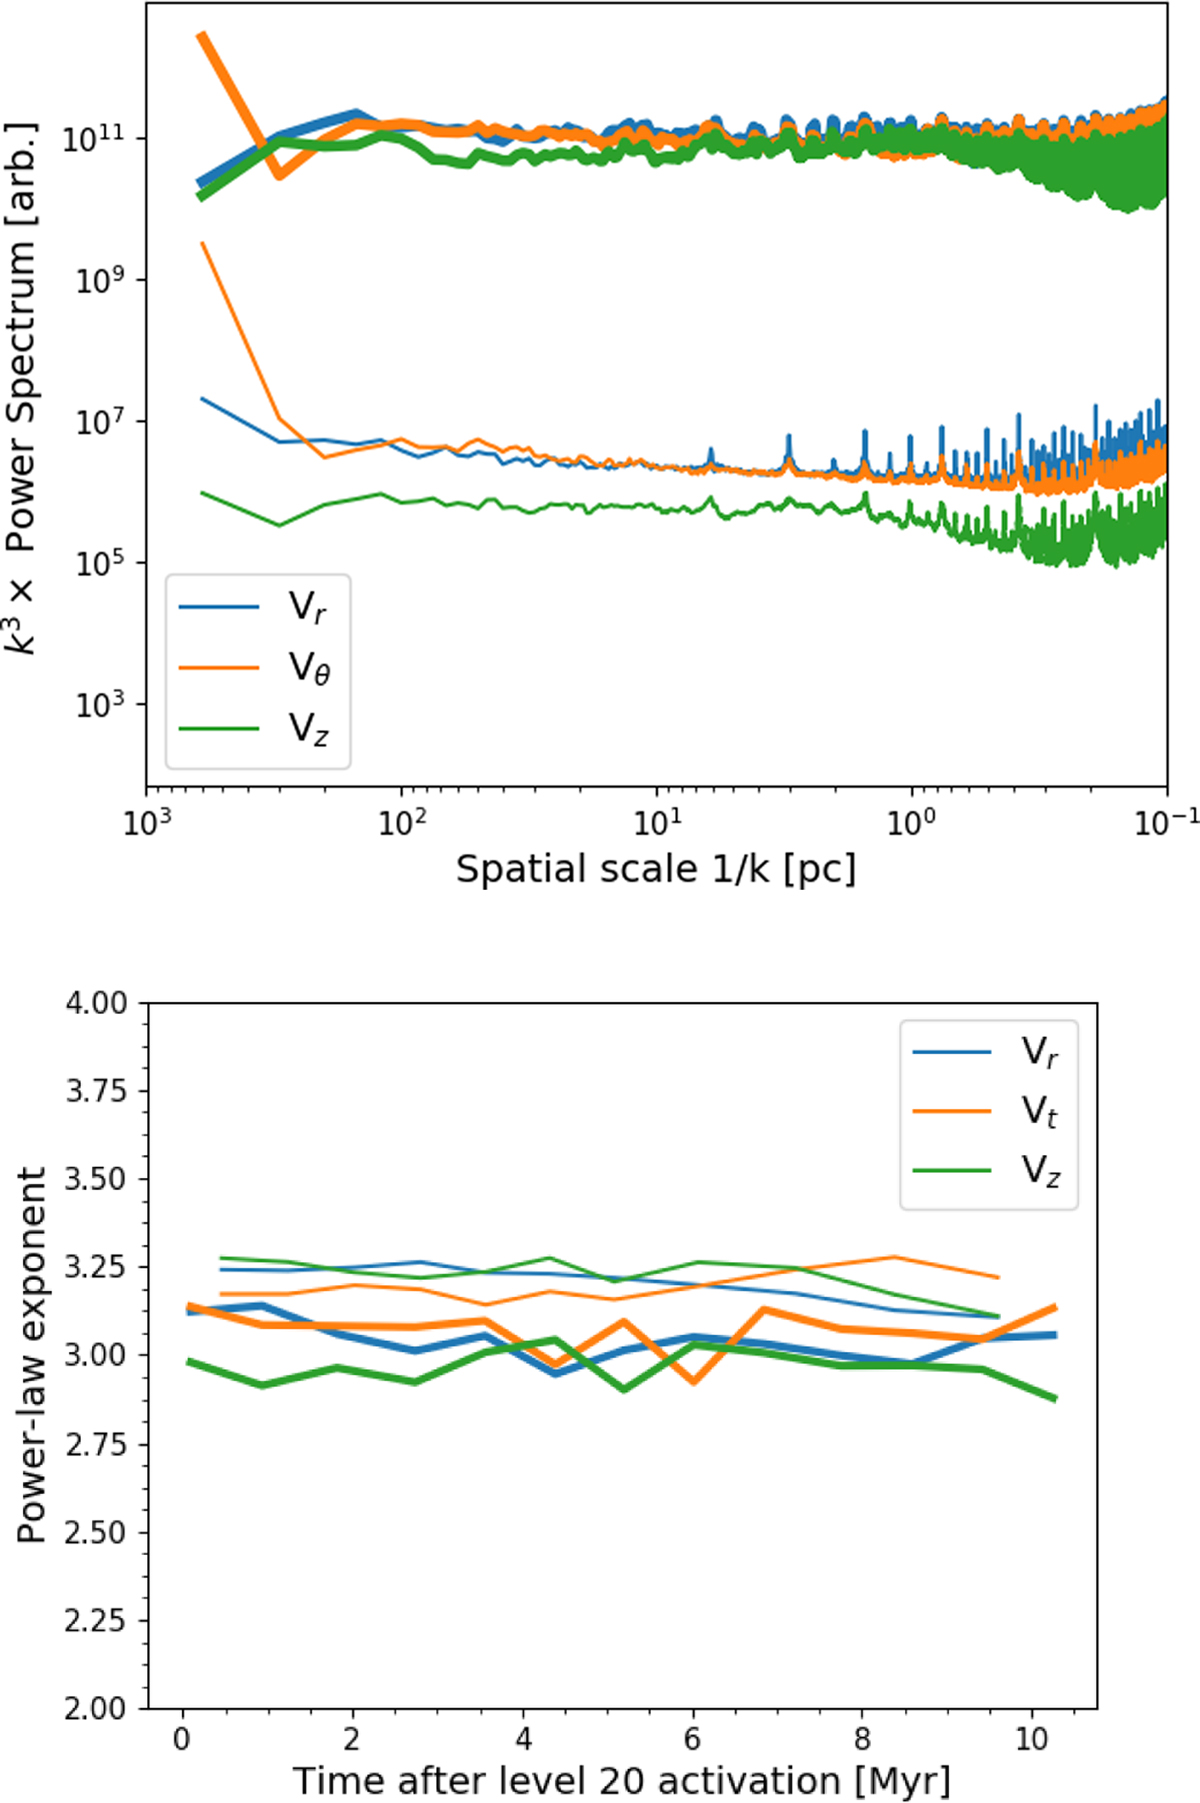
Fig. 10.
Download original image
Velocity power spectra for the two simulations. Top panel: 2D power spectrum of the three velocity components 10 Myr after the activation of level 20. The curves are compensated by k3. Curves from to the F65 run are plotted in bold, and the thin lines show the F10 run. The F10 power spectra are shifted down by 3 dex for the sake of clarity. Bottom panel: evolution of the power-law index of the fit of the velocity power spectra. Curves related to the F65 run are shown in bold.
Current usage metrics show cumulative count of Article Views (full-text article views including HTML views, PDF and ePub downloads, according to the available data) and Abstracts Views on Vision4Press platform.
Data correspond to usage on the plateform after 2015. The current usage metrics is available 48-96 hours after online publication and is updated daily on week days.
Initial download of the metrics may take a while.